


29 September, chart overview for EURUSD and GBPUSD
EURUSD chart analysis
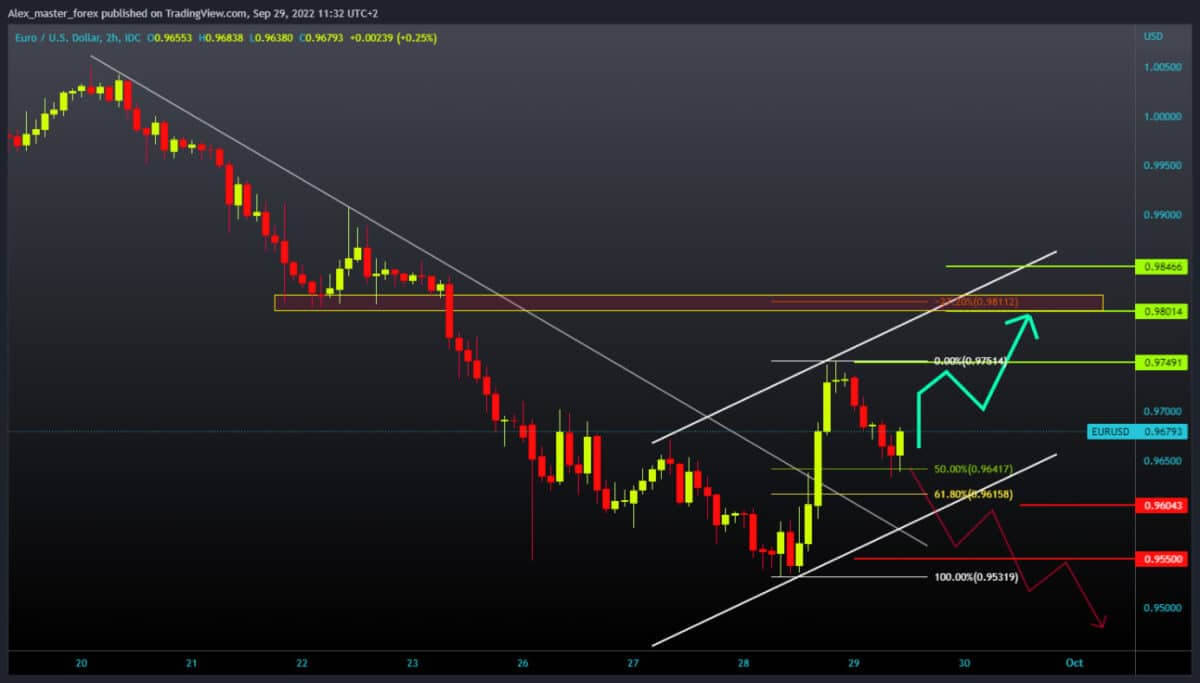
Yesterday, the pair EURUSD formed a new lower low at the 0.95320 level, after which we found support there and started a recovery. The euro succeeded in this and climbed to the 0.97500 level. During the Asian session, a new pullback followed, and we stopped at the 0.96330 level. Looking at this pullback, we found support between the 50.0%-61.8% Fibonacci levels. If we manage to stay at this level, a new bullish impulse could happen and retest last night’s maximum at the 0.97500 level. A potential higher target is the 0.98000-0.98500 resistance zone. We need a continuation of this morning’s negative consolidation and a drop below the 0.96300 support level for a bearish option. If we were to drop further below 0.96000, then we would probably retest yesterday’s low at the 0.95320 level. The potential lower target is at the 0.95000 psychological support level.

GBPUSD chart analysis
Pair GBPUSD formed a new higher low yesterday at the 1.05330 level. With the Fibonacci setup, we see that the pullback stopped at 61.8%. From that place, the pound starts a new bullish impulse up to the 1.09180 level. During the Asian trading session, we see a new pullback at 1.07710 at the 38.2% Fibonacci level. Here we have formed a new higher low and are moving into a new bullish impulse. Our target is the previous high at 1.09180, and we expect a break above to continue the bullish trend. Potential higher targets are 1.10000 and 1.11000 levels. We need a negative consolidation and a return to the previous support at the 1.07720 level for a bearish option. If we fail to find appropriate support there, the next target is yesterday’s low at 1.05330 level.


