USDCHF and USDJPY: USDJPY at multi-decade high at 156.85
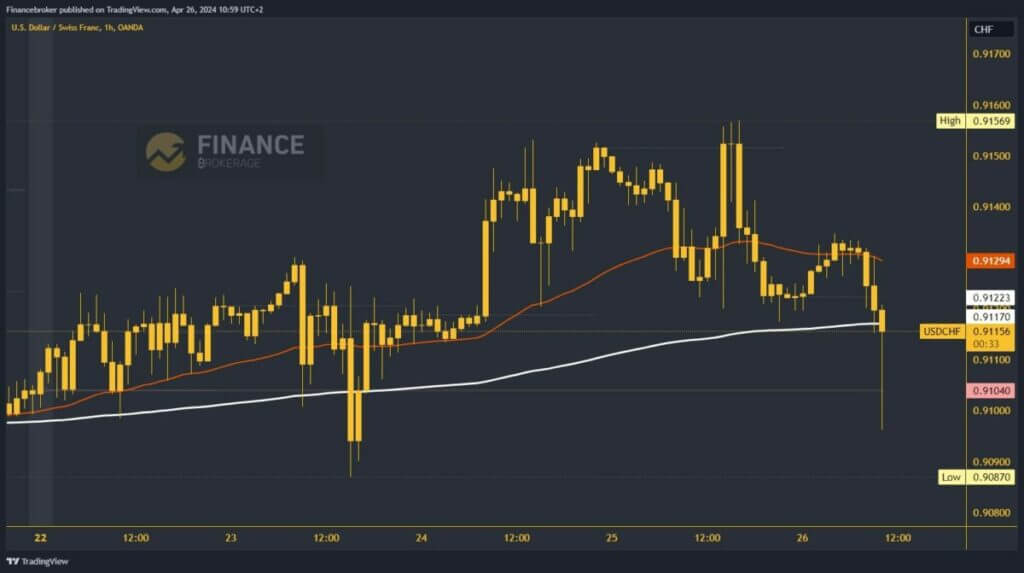
- USDCHF is under pressure until the formation of the weekly high at 0.91569.
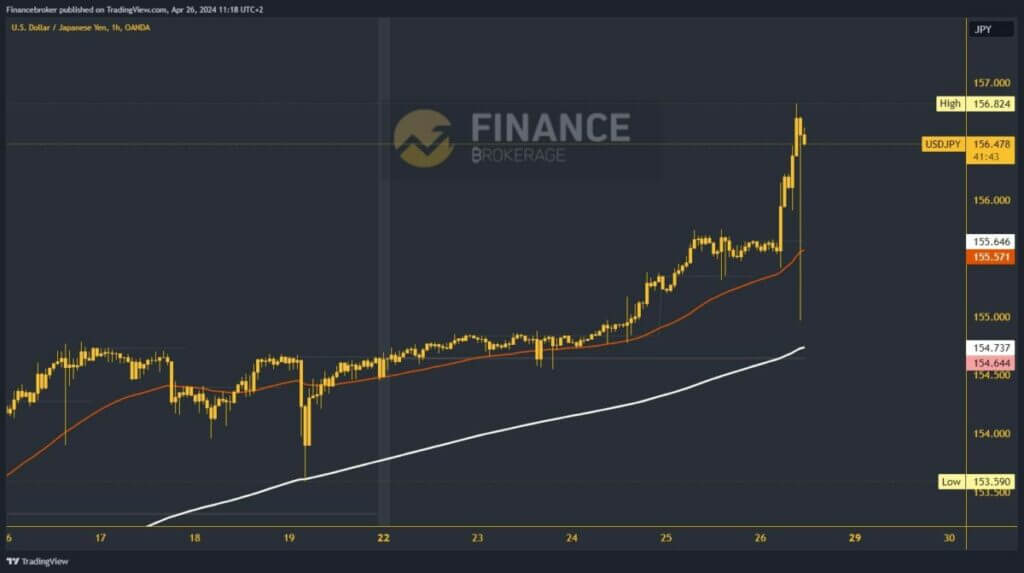
- The USDJPY reached a multi-decade high of 156.82.
USDCHF chart analysis
USDCHF is under pressure until the formation of the weekly high at 0.91569. Yesterday, we saw the first pullback to the 0.91200 level from that left.
During the Asian trading session, we managed to hold above and recover slightly to the 0.91350 level, where we encountered new resistance. From there, today’s bearish consolidation to a new daily low at the 0.90963 level was initiated.
USDCHF broke below the EMA200 moving average, increasing the pressure on the dollar and pushing it lower. By the end of the day, we may see this pair at a new daily and even weekly low.
Potential lower targets are 0.90900 and 0.90800 levels. We need to stabilize above the EMA200 and 0.91200 levels for a bullish option. After that, we have an opportunity to start a positive consolidation and continue this week’s bullish trend. Potential higher targets are 0.91300 and 0.91400 levels.

USDJPY chart analysis
The USDJPY reached a multi-decade high of 156.82. The last time we were there was in May 1990. We started the week at 154.64, and by Wednesday, we saw consolidation with support from the EMA50 moving average. After that, the pair breaks above the 155.00 level and rises to 155.35. On Thursday, we managed to hold that high by forming a new high at the level of 155.65.
This morning’s Asian session brings us fresh excitement and strong momentum above the 156.00 level. The Bank of Japan made the announcement and left interest rates unchanged at 0.10%, prompting the USDJPY to climb to a new multi-year high. So, we continued to a new high of 156.82. Potential higher targets are the 157.00 and 157.20 levels.


