


29 September, chart overview for Oil and Natural Gas
Oil chart analysis
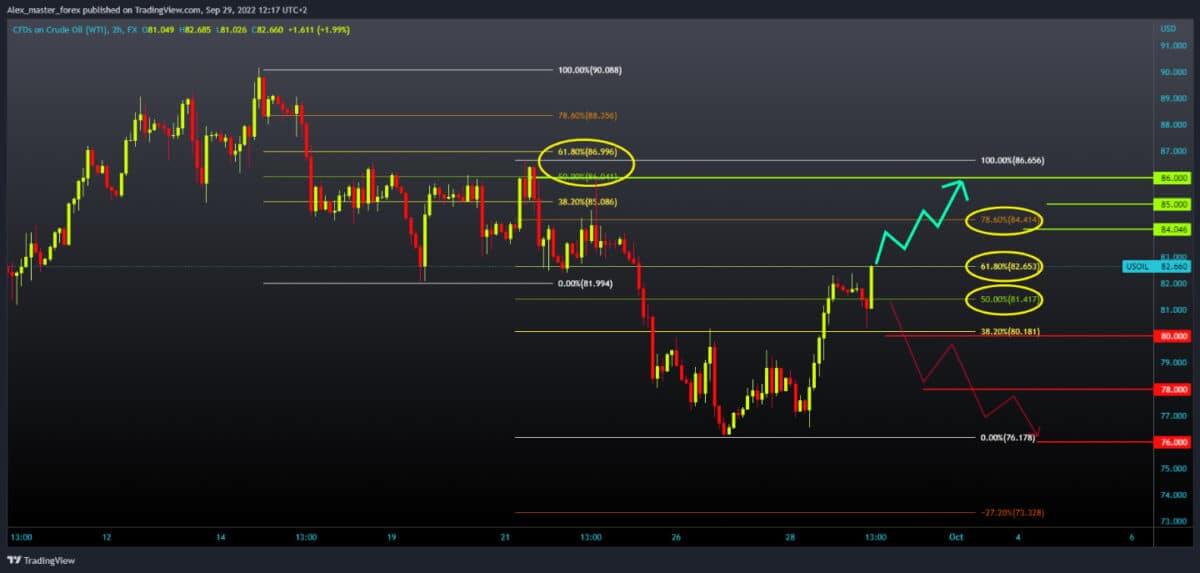
Yesterday, oil price made a positive leap, from the $76.00 level to the $82.00 level. During the Asian session, we saw a pullback to the $80.30 level and, very soon after that, a new bullish impulse that makes a break above this morning’s high. With the Fibonacci setup, we see that the pullback is now at the 61.8% level, and we need a break above to continue towards the next resistance at the 78.6% Fibonacci level at $84.40. Potential higher targets are $85.00, $86.00 previous high. We need a new negative consolidation and a drop in oil prices for the bearish option until this morning’s support at the $80.00 level. A price breakout below would only add to the bearish pressure. Potential lower targets are the $78.00 and $76.00 levels of the January low.

Natural gas chart analysis
During the Asian trading session, the price of natural gas was in the range of $6.90-$7.00. In the previous four hours, we have had a positive consolidation that could lead to a break above the $7.00 level. But we are very close to the resistance at the $38.2 Fibonacci level because two days ago, we tried to climb above it, but it was unsuccessful. Now we have another try, and the outcome might be different. By moving above, we would form a new higher high, and then we need to maintain at that level and continue the recovery with a new bullish impulse. Potential higher targets are $7.30 (50.0% Fibonacci level) and $7.50 (61.8% Fibonacci level). For a bearish option, we need a move away from the 38.2% Fibonacci level and a negative consolidation. Then the price could look for the first support at the $6.80 level. And if it fails, it will return to the lower support zone of $6.40-$6.60. Potential lower targets could be $6.20 and $6.00.

