S&P 500 and Nasdaq: S&P 500 is close to crossing 5100.0
- The S&P 500 managed to consolidate above the 5000.0 level this week.
- From Monday to Wednesday, the Nasdaq was in bullish consolidation up to 17655.0 levels.
S&P 500 chart analysis
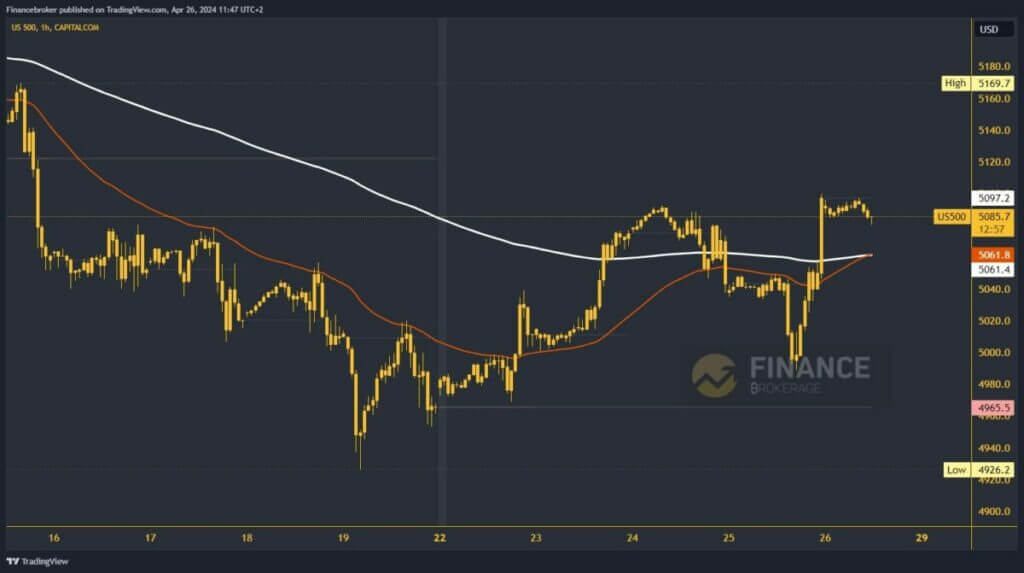
The S&P 500 managed to consolidate above the 5000.0 level this week. Yesterday, we saw a retest at that level, after which a bullish consolidation up to the 5099.7 level was initiated. During this morning’s Asian trading session, the index was under pressure at that level and retreated to the $5085 level. It is still holding well and stable even though we are under slight bearish pressure. We expect to see a drop to the 5060.0 level and test the EMA200 moving average there.
We hope new support will continue to the bullish side from that level. If the support does not hold, potential lower targets are the 5040.0 and 5020.0 levels. We need a positive consolidation and a jump above the 5100.0 level for bullish. With this, we climb to a new weekly low and significantly relieve the bearish pressure. A potential higher target is the 5120.0 and 5140.0 levels.

Nasdaq chart analysis
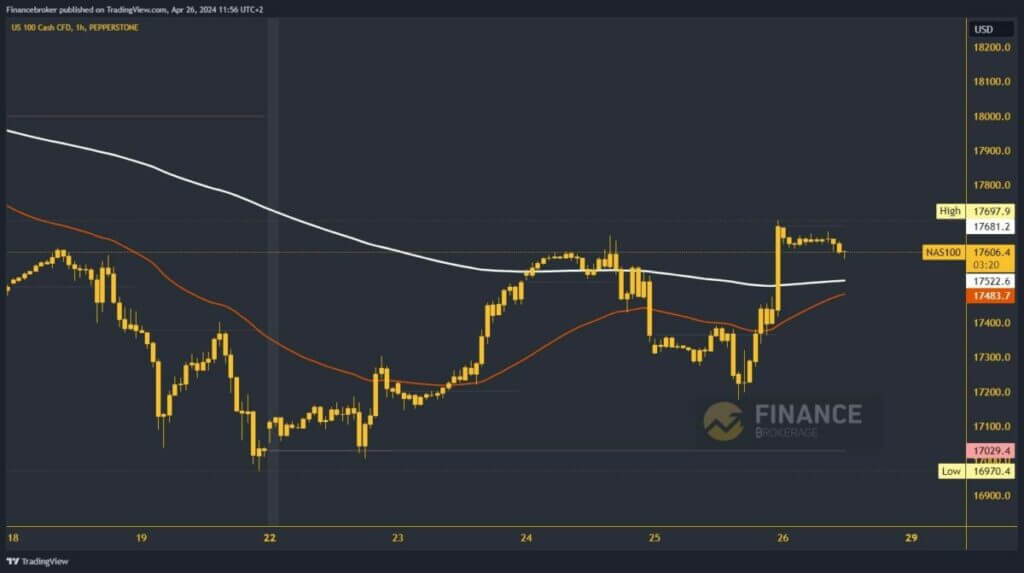
From Monday to Wednesday, the Nasdaq was in bullish consolidation up to 17655.0 levels. After which we saw a pullback to support at 17200.0. There, the decline stopped, and a positive consolidation on the bullish side was initiated, taking us to a new weekly high at 17681.2 level last night. During this morning’s Asian trading session, the Nasdq was under slight pressure, falling to 17600.0.
We are approaching the US session and expect increased volatility at the start. This could take us down to the 17520.0 level and test the EMA200 moving average support. Potential lower targets are 17500.0 and 17400.0. We expect this zone to provide us with enough support to turn to the bullish side again and climb to a new weekly high.


