Oil and Natural Gas: New Lower High
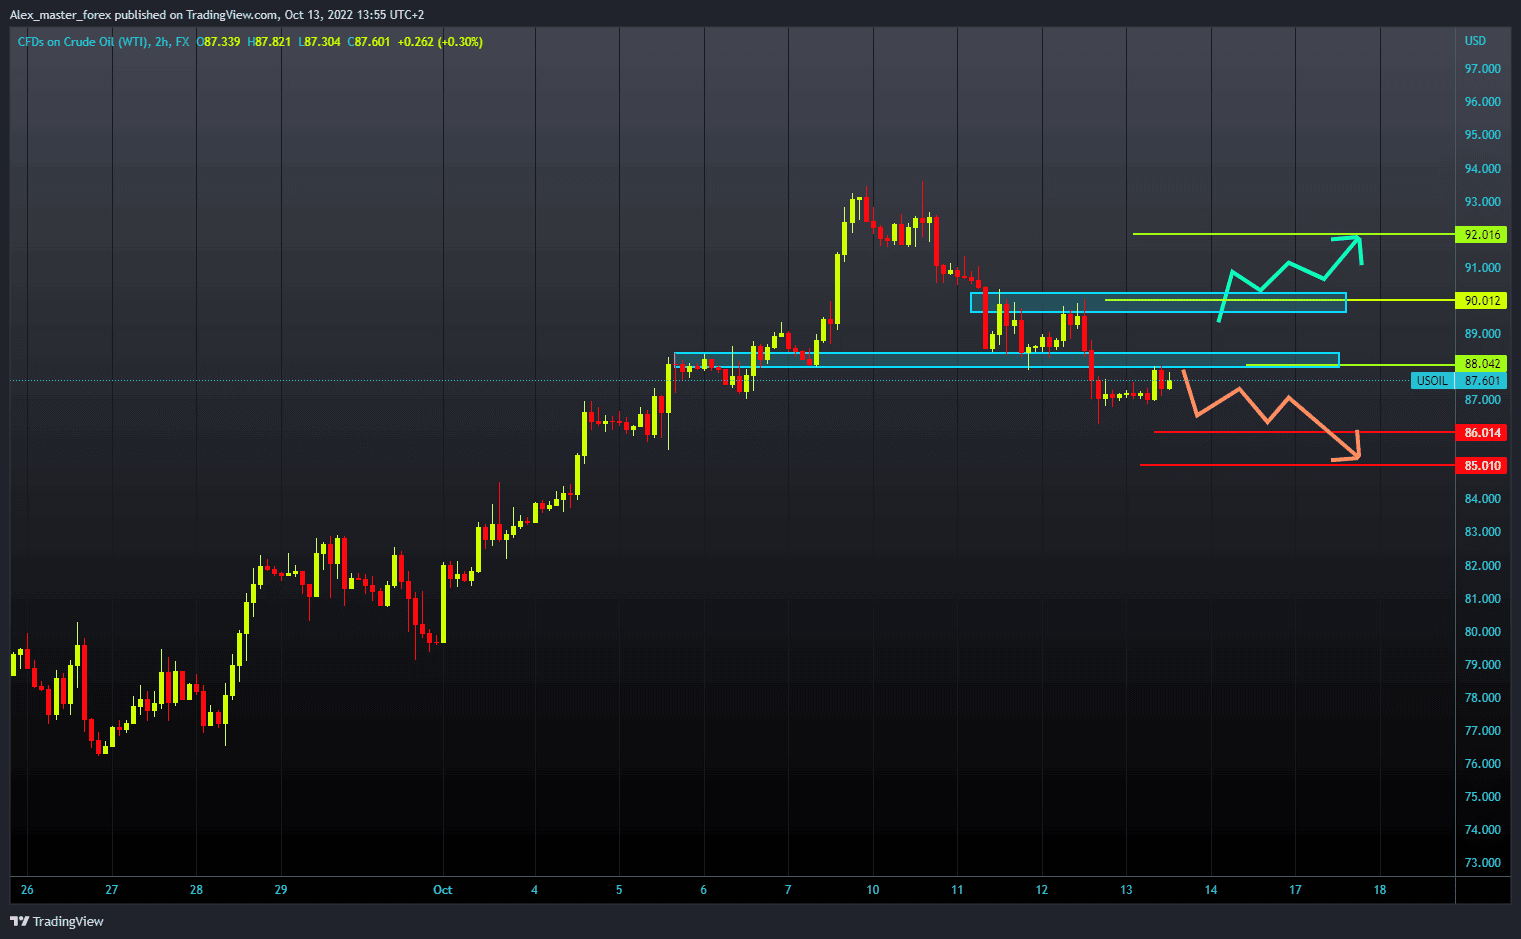
- During the Asian trading session, the price of oil was calm and hovered around the $87.00 level, after which it climbed to the $88.00 level with a bullish impulse.
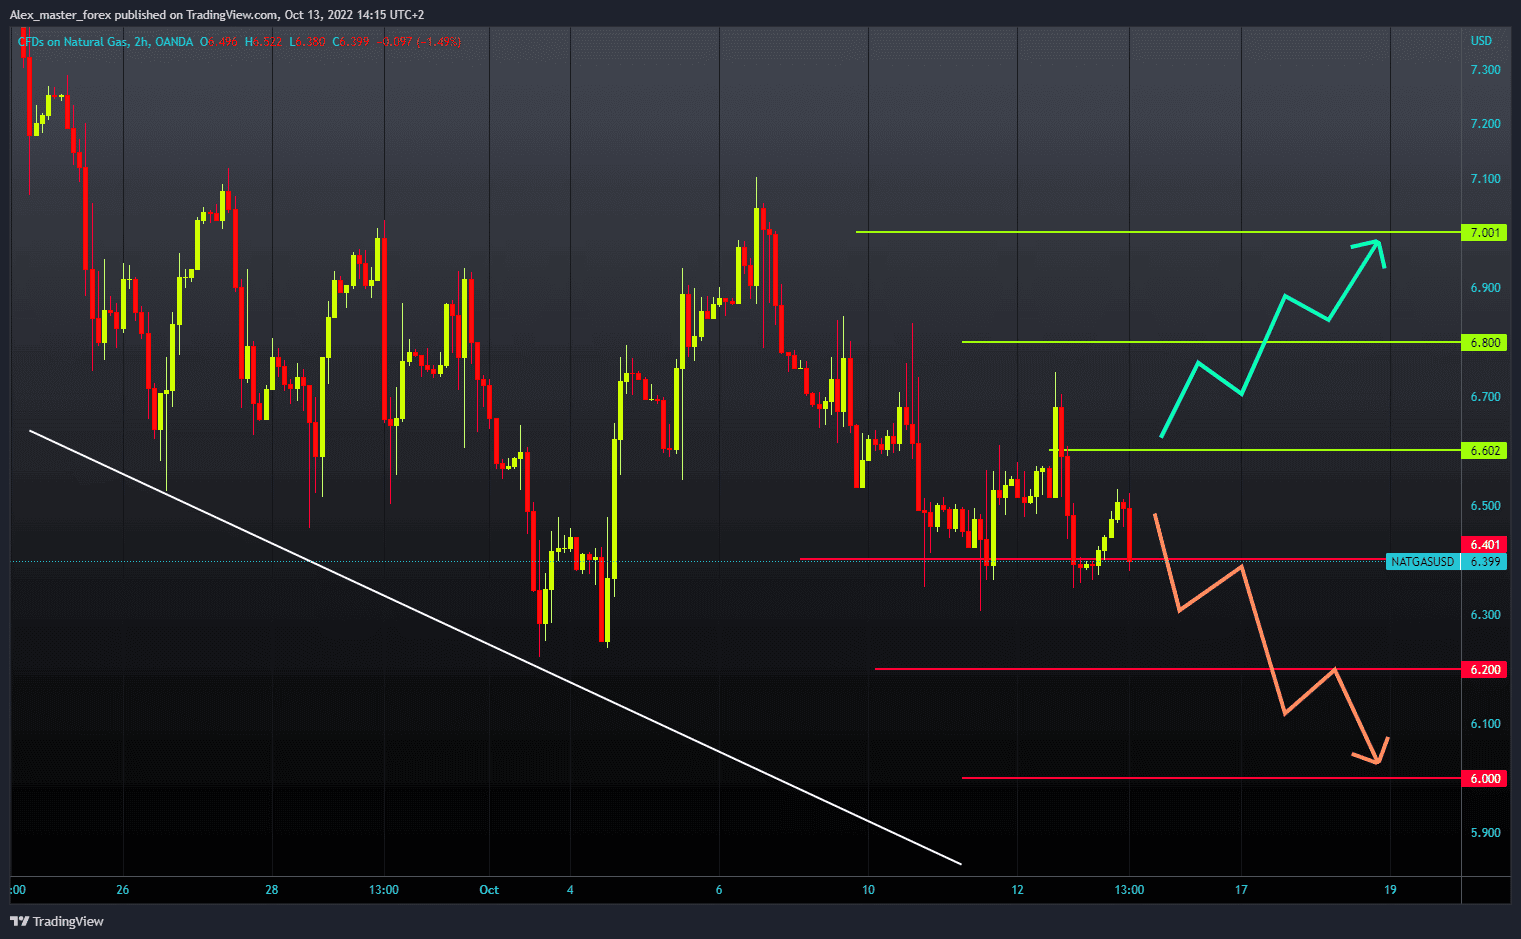
- Yesterday, the price of natural gas only managed to form a new lower high at the $6.75 level and start a new pullback.
Oil chart analysis
During the Asian trading session, the price of oil was calm and hovered around the $87.00 level, after which it climbed to the $88.00 level with a bullish impulse. For now, we have resistance at that point, and we need a break above to continue the recovery, and our main target is the $90.00 level of resistance. If the price managed to climb above $90.00, it would form a new three-day higher high, and a continuation of the recovery could be expected. Potential higher targets are the $91.00 and $92.00 levels. We need a negative consolidation and pullback below the $87.00 support level for a bearish option. A drop in the price of oil below could determine the future trend of the price of oil in the longer term. Potential lower targets are the $86.00 and $85.00 levels.
Natural gas chart analysis
Yesterday, the price of natural gas only managed to form a new lower high at the $6.75 level and start a new pullback. It did that until the $6.35 level, where we stopped last night. During the Asian trading session, the price of natural gas began to recover again, but only up to $6.55, forming a new lower high. We now see a new pullback to the $6.40 level and could retest yesterday’s low. A price drop below would form a new seven-day lower low and a potential test of October support at the $6.20 level.
For the bullish option, we need a positive consolidation and a minimum growth of up to $6.60. Thus we would form a new today’s high. After that, the gas price would have a better chance of climbing to the previous high from the day before at the $6.75 level. Potential higher targets are the resistance zone around $6.80 and the next high at the $7.00 level.