Gold and Silver: Prices fell sharply
- Since the beginning of the week, the price of gold has been between $1660-$1685.
- After the US inflation report, the price of silver fell sharply as the data showed that inflation was still strong.
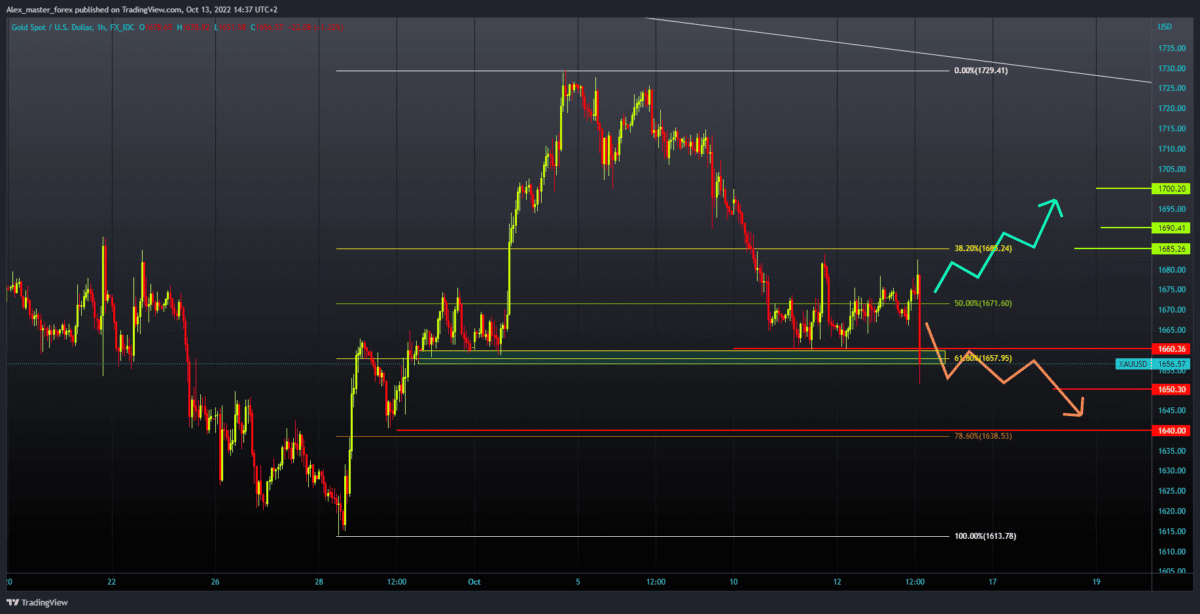
Gold chart analysis
Since the beginning of the week, the price of gold has been between $1660-$1685. The situation is the same today, although the price formed a higher low as if we could see a breakthrough above. The price was again above the $1680 level today, while it is now at the $1675 level, waiting for data on American inflation. For a bullish option, we need positive consolidation and a break in the price of gold above the $1685 level. After that, we need to stay there to consolidate and continue to grow with a new bullish impulse. Potential higher targets are $1690 and $1700 levels. We need a negative consolidation and a return to the support zone around the $1660 level for the bearish option. A longer hold in that zone could add pressure on the price, and we could see a break below. Potential lower targets are $1650 and $1640 levels.
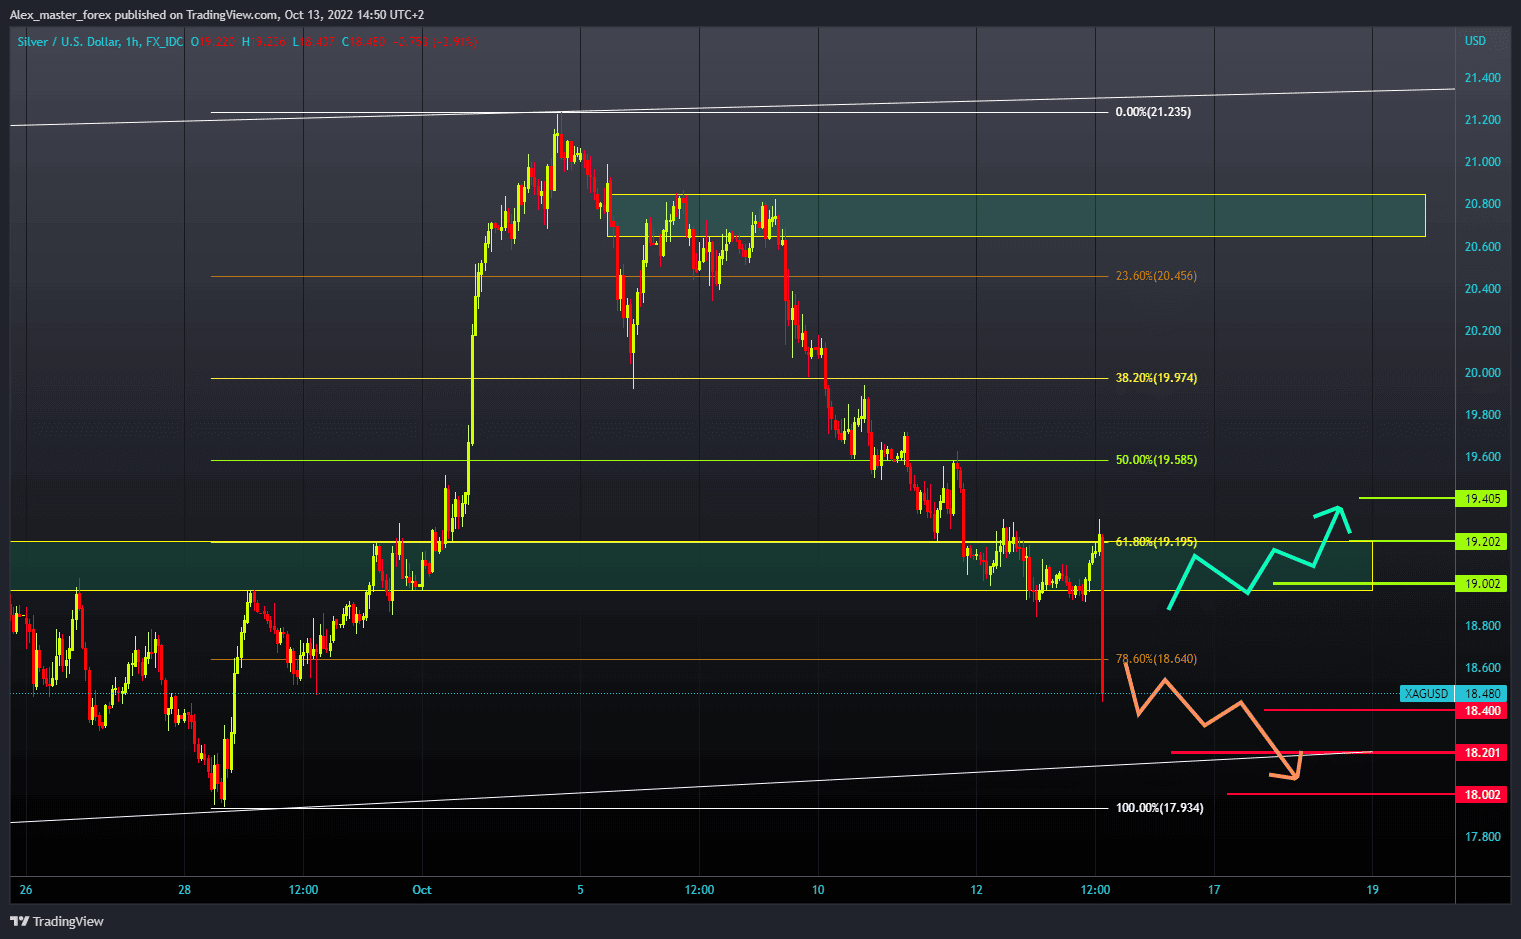
Silver chart analysis
After the US inflation report, the price of silver fell sharply as the data showed that inflation was still strong. These results further strengthened the dollar, which caused goods denominated in dollars to fall. Potential lower support targets now are $18.40, $18.20 and $18.00 levels. For a bullish option, we need another positive consolidation and a return to the $19.00 level of previous support. Then we must stay in that zone and climb above the $19.20 level. After that, the price could more easily continue the bullish recovery with a new bullish impulse. Potential higher targets are the $19.40 and $19.60 levels.