USDCHF & USDJPY Analysis: USDJPY Steady Above 147.50
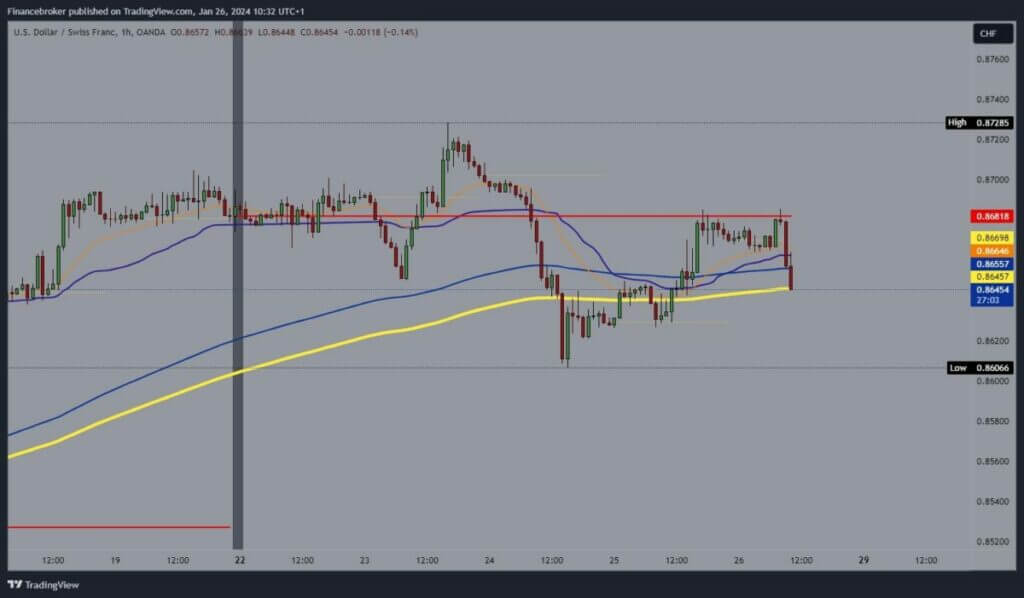
- On Tuesday, we saw this month’s high USDCHF at the 0.87285 level.
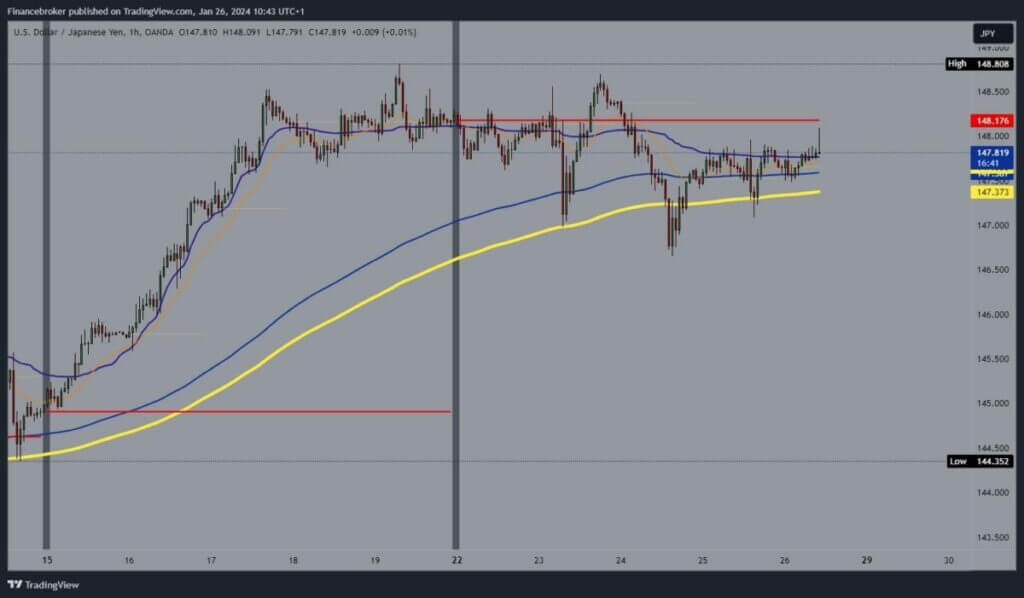
- This week, the USDJPY pair is in a sideways consolidation in the 147.00-148.50 range.
USDCHF chart analysis
On Tuesday, we saw this month’s high USDCHF at the 0.87285 level. After which, the dollar began to weaken, and this pair began to retreat. We find support on Wednesday at the 0.86066 level and stop the pullback there. From that moment, we started the recovery that lasted all day yesterday and continued during the previous Asian session. We encounter resistance at the 0.86852 level, and on two occasions, we bounce off it and make a pullback.
USDCHF is now at the 0.86530 level and is testing the EMA200 moving average support. A new breakout could easily occur below it, which would influence us to go down and test yesterday’s support level. Potential lower targets are 0.86400 and 0.86200 levels. If we manage to stay above the EMA200 level, the pair could initiate a new bullish consolidation with targets above this week’s.

USDJPY chart analysis
This week, the USDJPY pair is in a sideways consolidation in the 147.00-148.50 range. We have good support from the EMA200 moving average, which is now above the 147.30 level. During the previous Asian session, the pair was maintained above 147.50, but we now encounter resistance at the 148.00 level. We need a stronger bullish impulse to move us higher. After that, we could test this week’s high and form a new one.
Potential higher targets are $148.50 and $149.00 levels. We need a pullback below the EMA200 and 147.25 levels for a bearish option. Then, there would be an increase in bearish momentum on this USDJPY to start a further retreat to lower levels. Potential initial targets are 147.00 and 146.50 levels.


