Bitcoin and Ethereum: Ethereum still in the zone around 2200
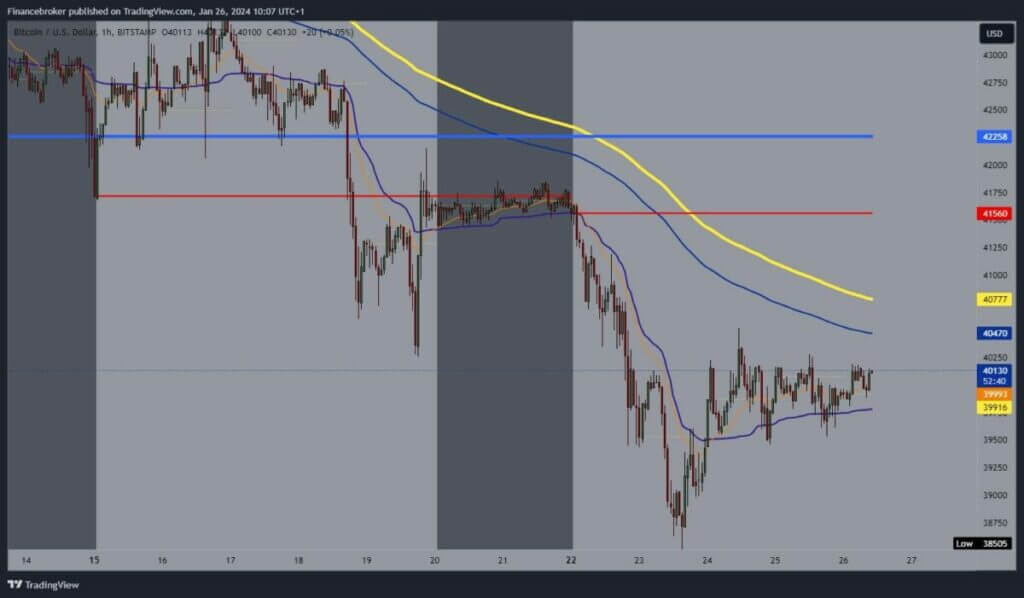
- The price of bitcoin is in a three-day mild bullish consolidation.
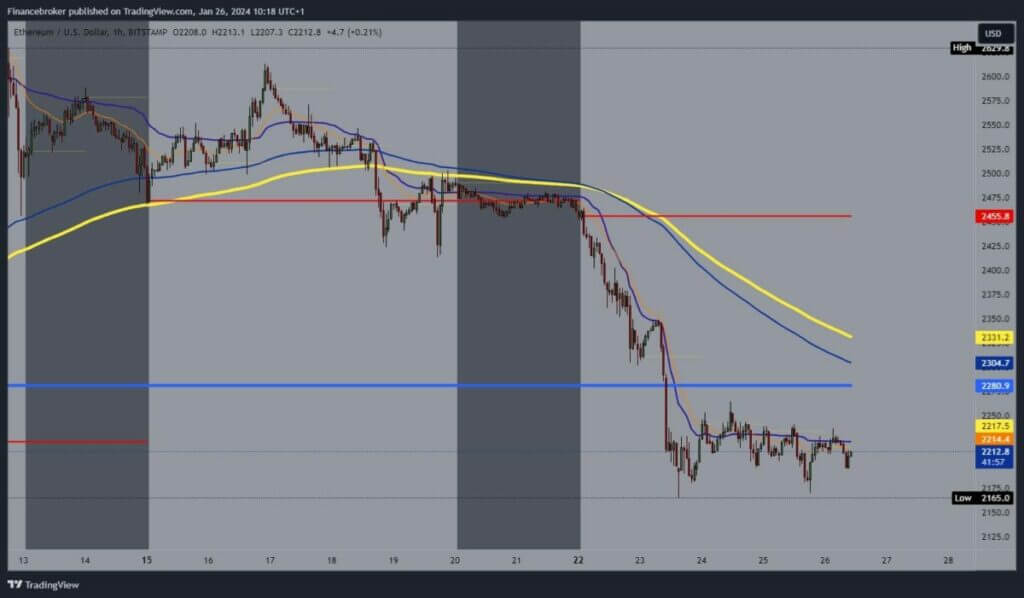
- As of Tuesday, the price of Ethereum is in a sideways consolidation in the $2165-2250 range.
Bitcoin chart analysis
The price of bitcoin is in a three-day mild bullish consolidation. We are moving in the $39500-$40200 range. Today, we are above the $40,000 level, and we expect to see continued growth to the bullish side. We need to break the $40,300 level in order to break free and start a further uptrend. Potential higher targets are $40500 and $40750 levels.
The EMA200 moving average could be the next resistance in the zone around the $40750 level. The first pullback to the $39,500 support level is required for a bearish option. New pressure on that level could make a break below and form a three-day price low. Potential lower targets are $39250 and $39000 levels.

Ethereum chart analysis
As of Tuesday, the price of Ethereum is in a sideways consolidation in the $2165-2250 range. It is quite gloomy on the chart, but some explosive impulse up or down can be expected. Since we are in the support zone, we can say that the bearish pressure is more dominant, and we lean more towards that side. A new pullback to the previous low would only strengthen the momentum, and we would see a drop below and the formation of a new price low.
Potential lower targets are $2140 and $2120 levels. We need a positive consolidation and a move up to the $2250 level for a bullish option. Staying in that zone would provide us with a good position for potential further growth on the bullish side. Potential higher targets are $2260 and $2280 levels. The EMA200 moving average is up around the $2330 level.


