Oil and natural gas: oil fell to $83.00 level this morning
- Last week’s high oil price was formed on Friday at $84.42.
- The price of natural gas fell to $1.70 on Friday evening.
Oil chart analysis
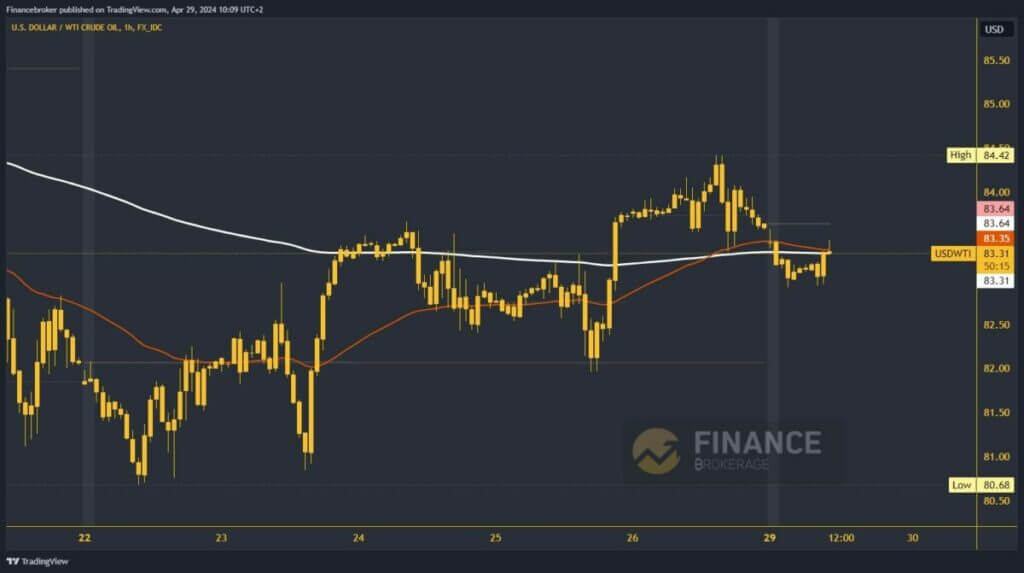
Last week’s high oil price was formed on Friday at $84.42. We started a pullback from that level that continued in this morning’s Asian session. The pullback was stopped at the $83.00 level, and for now, we are successfully holding above. We are pulling back to $83.50 and trying to stay above the EMA200 moving average.
If we succeed in this, we will be able to start a new positive consolidation, and we expect a move above the weekly open price. Potential higher targets are $84.00 and $84.50 levels.
We need a negative pullback of the oil price below the $83.00 level for a bearish option. With that, we go to a new daily low and get confirmation of bearish swings. Potential lower targets are $82.50 and $82.00 levels.

Natural gas chart analysis
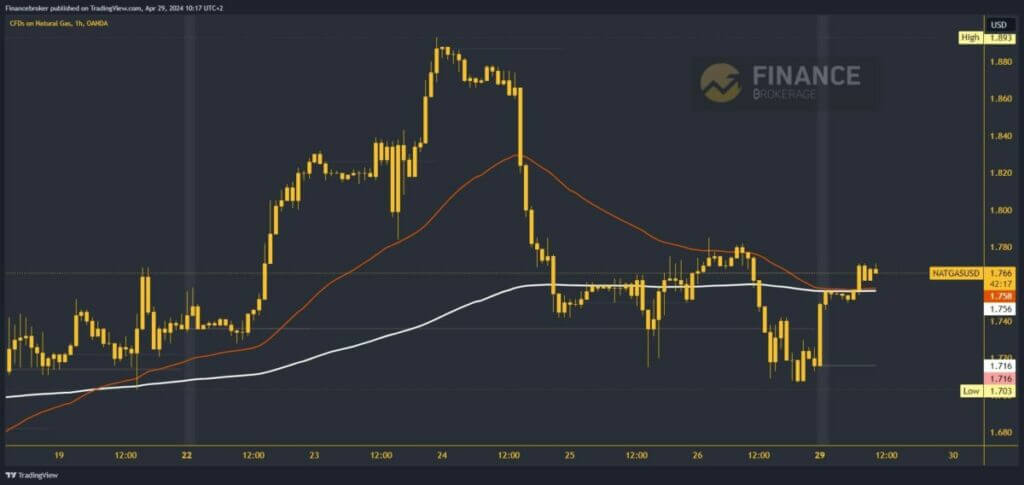
The price of natural gas fell to $1.70 on Friday evening. At the start of this morning’s Asian session, we saw a bullish impulse up to the $1.75 level.
After that, we moved into the zone of that level, and with a new impulse, we moved above, moving to the $1.76 level. We are getting support from the EMA200 moving average and hope for further recovery to the bullish side.
Potential higher targets are $1.78 and $1.80 levels. $1.78 is Friday’s level of resistance; crossing above it will make it easier for us to proceed to the bullish side.
For a bearish option, we need a negative consolidation and pullback below $1.75 and the EMA200 moving average. This brings us back to the bearish side, and after that, we expect to see a further pullback in the price of natural gas. Potential lower targets are $1.7400 and $1.72 levels.


