Oil and natural gas: The oil in a pullback to $78.00
- During the Asian trading session, the price of oil reached the $79.00 level, after which we saw a pullback.
- During the Asian trading session, the gas price falls to a new low at the $4.50 level.
Oil chart analysis
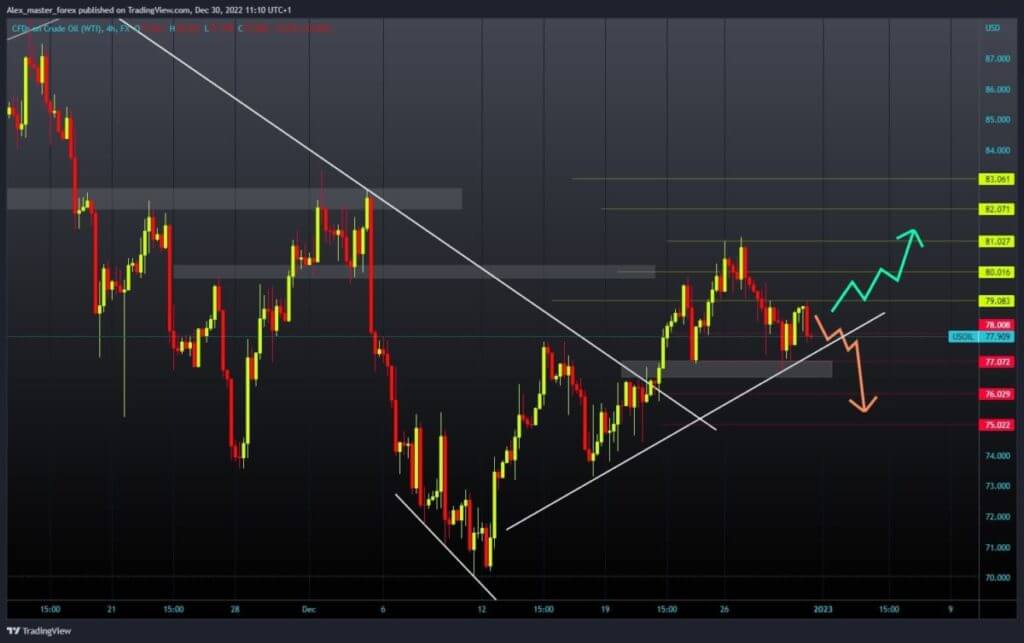
During the Asian trading session, the price of oil reached the $79.00 level, after which we saw a pullback. The price of oil dropped to $77.70. Yesterday we had support at $77.00, and we may revisit that support zone today. Additional price support is in the trend line on the downside. We need to get back above the $79.00 level for a bullish option and stay up there.
With a new bullish impulse, we would continue the recovery of oil prices. Potential higher targets are $80.00 and the $81.00 level. We need a negative consolidation and a drop below the $77.00 level for a bearish option. After that, we could expect to see continued oil price weakness. Potential lower targets are the $76.00 and $75.00 levels.

Natural gas chart analysis
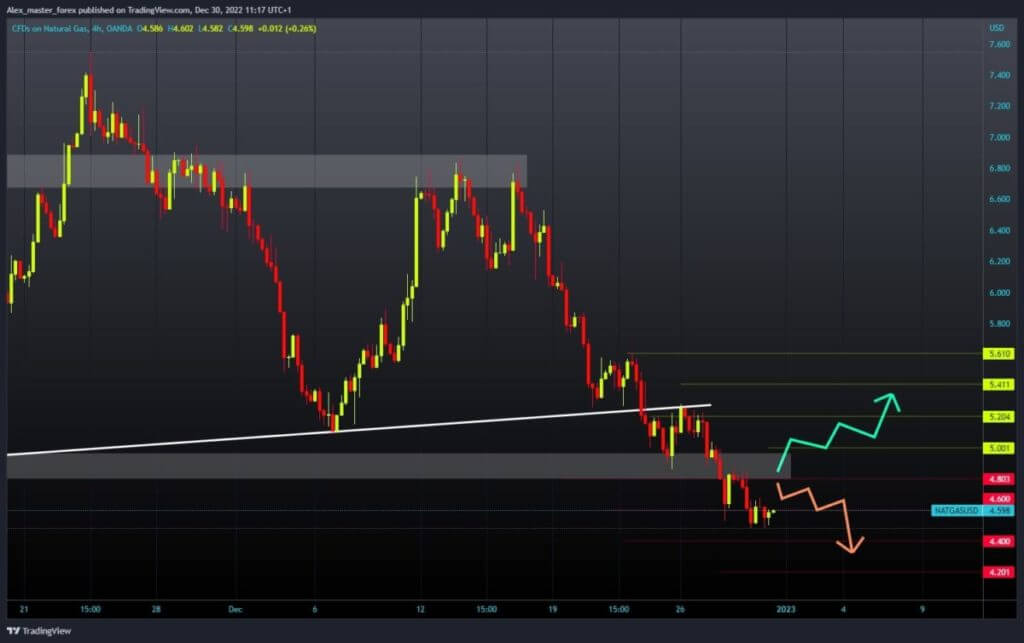
During the Asian trading session, the gas price falls to a new low at the $4.50 level. In the previous 15 days, the gas price lost 34.0% of its value, falling from $6.80 to $4.50. Now we see that the gas price managed to stop the fall and move slightly towards the $4.60 level. We need a positive consolidation and a return to the $4.80 level for a bullish option. A breakout of the gas price above and staying above it would greatly benefit us for further recovery. Potential higher targets are the $5.00 and $5.20 levels. We need a negative consolidation and a price drop below the $4.50 level for a bearish option. Below, potential lower targets are the $4.40 and $4.60 levels.


