


USD/JPY forecast for February 3, 2021
Looking at the chart for the USD/JPY pair on the weekly time frame, we see that this year the dollar is on the bullish side against the Japanese yen. After support at 102.70, the part went up, with current support with a moving average of MA20 and EMA20 with a view to MA50 as potential resistance at 105.80. As a tool, we can also use Fibonacci retracement levels, where the USD/JPY pair finds support at 78.6% levels. Based on that bullish target, we can be Fibonacci level 61.8% at 106.50. Before that, our psychological resistance was 106.00.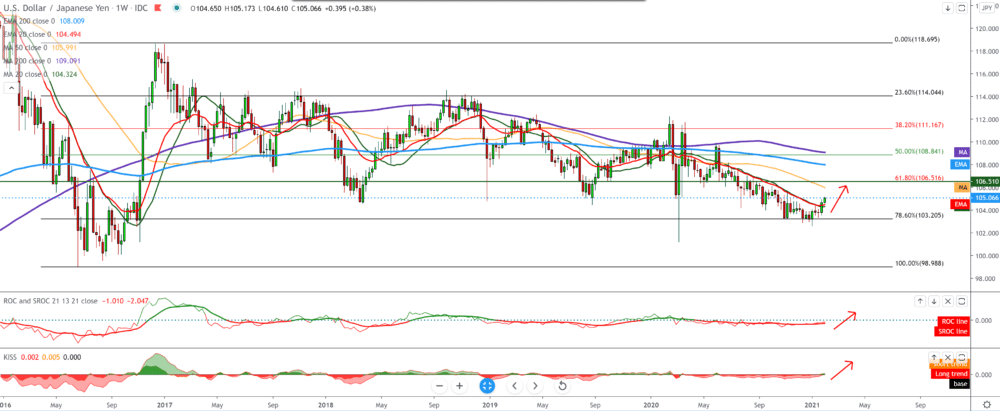
On the daily time frame, the USD/JPY pair has support for moving averages MA20, MA50, and EMA20. Based on that, we can conclude that the pair will reach the value of MA200 and EMA200 moving averages, and then we can expect consolidation at that level around 106.00. Our first bullish target is 105.50, and if we see a break above then, we can expect a jump to 106.00. For the bearish scenario, we need a rejection of EMA200 or MA200, and then we return to lower levels at 104.00.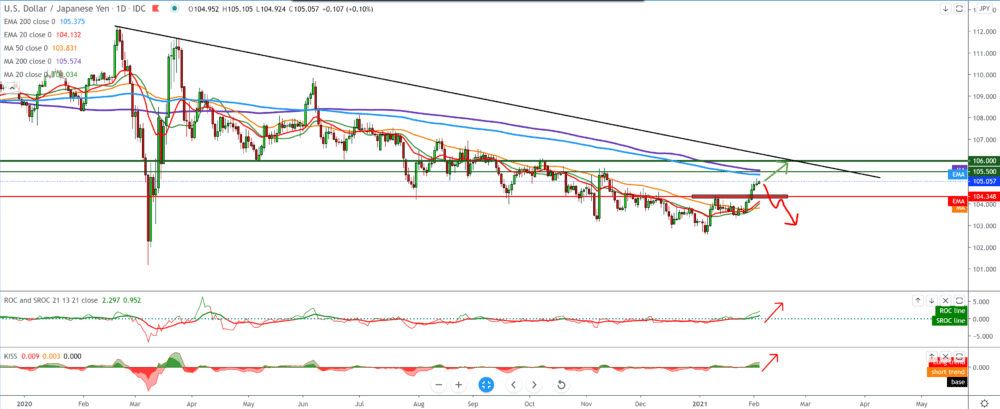
Check-out Financebrokerage’s Comprehensive Review on Fundiza
On the four-hour time frame, we see a strong bullish trend, a pullback that occurred at a Fibonacci level of 61.8%, and then a continuation to the bullish side. The lower lows have formed a lower trend line, and we can use it as a potential support the USD/JPY pair towards higher levels. Our market is the previous high from November 2020 at 105.70, and a little above that, we are waiting for the high from October 2020 at 106.00. If we don’t see a break above those levels, we go to the bearish side again. For that, we need a break below 104.50 with less consolidation with signs of weakening dollars.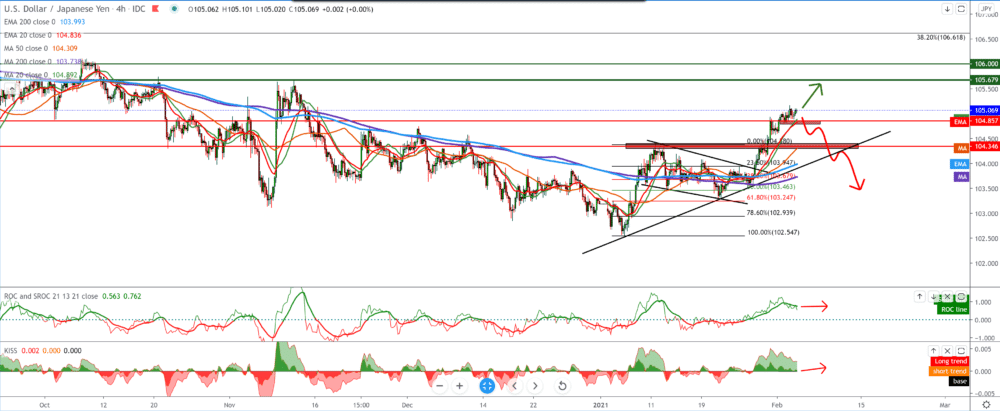
-
Support
-
Platform
-
Spread
-
Trading Instrument

