The price of gold remains on the way to the $1800 level
- In the first three weeks of September, the price of gold was in the range of $1,900-$1,950.
Gold chart analysis
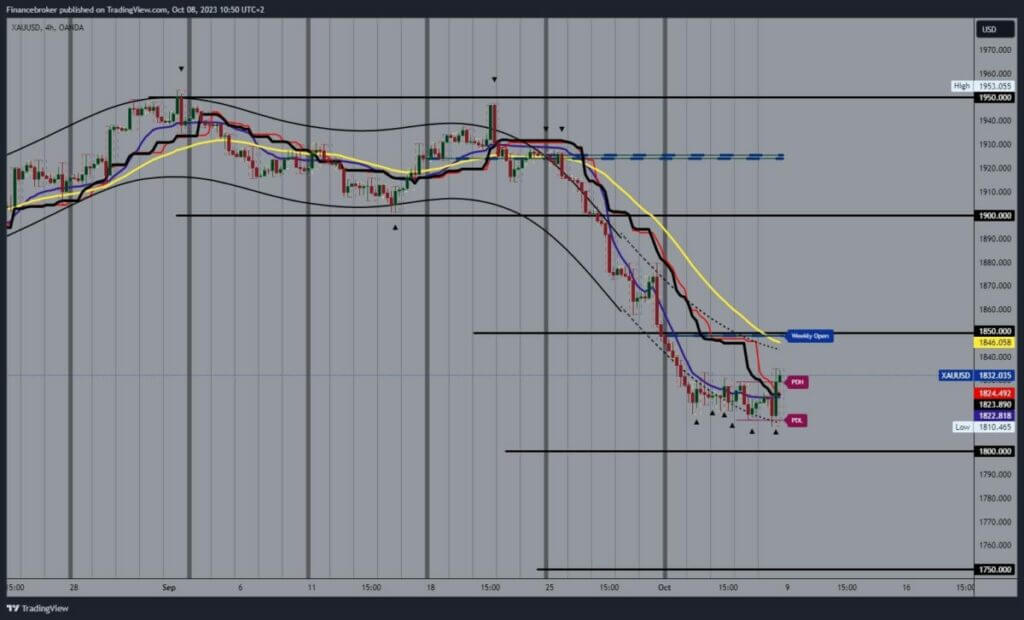
Today’s chart review will be on a four-hour time frame in order to give us a broader overview of gold price movements in the previous period, and based on that, we will analyze the future potential trend.
In the first three weeks of September, the price of gold was in the range of $1,900-$1,950. Failure to break above $1950 puts more pressure on the price at $1900, which led to a break below and a drop to the $1850 level in the last week of September.
Looking at the EMA50 moving average, we see how, at the beginning of the last week in September, the price of gold breaks away from the EMA50 and drops to the $1900 level. The breakout below was very fast and strong, and the price already fell to the $1860 level in a couple of days. There, we see an attempt to stop further decline and resistance to the $1880 level, where we encounter new resistance and start another pullback.

The price of Gold since the beginning of October
The beginning of October only continued with further retreats, and the price of gold formed a lower low at the $1810 level. Yesterday, there was a weakening of the dollar, which had the effect of gold recovering slightly to the $1,834 level. In the next week, we could expect to see a rise to the $1850 level, and there, we would encounter the EMA50 moving average.
A breakout of the gold price above would increase optimism and greatly ease the pressure on the price to continue its further recovery. Potential higher targets are $1875 and $1900 levels. If we stay below the $1850 level, the price of gold remains under pressure to go down to the $1800 level. The last time we were there was in December last year. With the falling price of gold below this level, we enter the next zone of $1750-$1800.


