


The price of Bitcoin is in a rush towards the $29000 level
- On September 11, the price of Bitcoin started the current bullish rally from the $24920 level.
Bitcoin chart analysis
Today’s chart review will be on a four-hour time frame in order to give us a broader overview of Bitcoin price movements in the previous period, and based on that, we will analyze the future potential trend.
On September 11, the price of Bitcoin started the current bullish rally from the $24920 level. By the end of that week, we managed to climb up to the $26,800 level. In the following week, bitcoin continued to grow up to $27500, and there it encountered the first obstacle. After that, we see a bearish consolidation to support at the $26000 level.
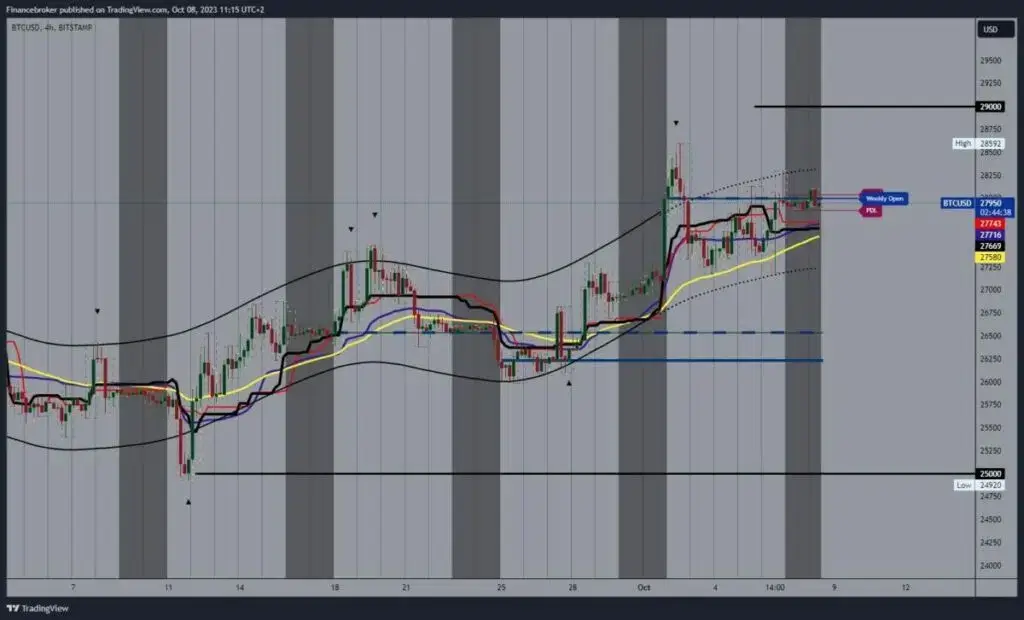
Initiation of a new bullish consolidation
The price gets the desired support at the $26,000 level and initiates a new bullish consolidation that formed a new high at the $28,592 level last Monday. We encounter new resistance at that level and pull back to the $27,200 support level. There, we form a higher low and start the current bullish consolidation that pushes us to the $28000 level.
During this period, we have support in the EMA50 moving average, which gives us optimism that we could climb up to the $29,000 level. In this way, we form a new higher high and confirm the dominance of the bullish trend. The previous time we were in that zone was in the last week of August.
For a bearish option, we need a pullback below the EMA50 moving average and a $27,000 support level test. If we could see it on the chart, we could think about a further fall in the price of Bitcoin to lower previous levels. The decline could be deeper to support in the $26000-$26200 zone. The current picture tells us that Bitcoin is in a bullish surge, and there is no bearish indication on the chart on the 4h time frame.

