The dollar index is under pressure at the 104.00 level
- The dollar index is making a big pullback this week.
Dollar index chart analysis
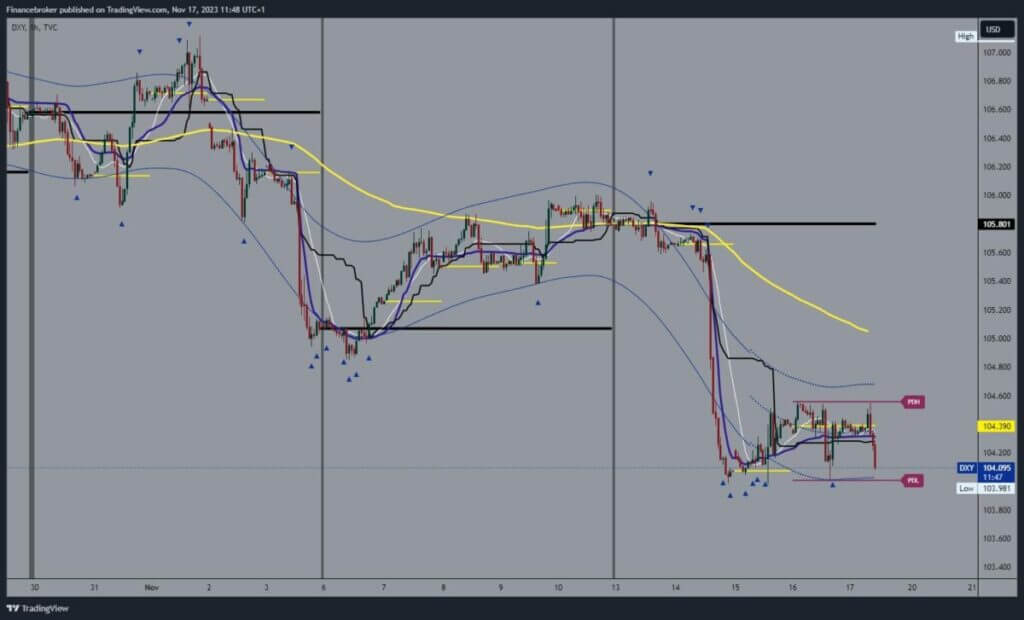
The dollar index is making a big pullback this week. We started on Monday at 106.00 levels, after which we saw a pullback on Tuesday to 103.98. The reason for this retreat is the decline in US inflation reports. At the annual level in the previous October, inflation was 6.7%, and this year, in October, it was 4.6%. This kind of data is an indicator that the FED could start with indications of a potential reduction in the interest rate.
After falling to the 104.00 level, the dollar index moved in a lateral consolidation in the 104.00-104.60 range. For now, 104.60 represents resistance, and we would have to break above it if we want to see a recovery on the bullish side. Potential higher targets are 104.80 and 105.00 levels.

The 104.00 level is a support line for the dollar.
We need a negative consolidation and a break below the 104.00 support level for a bearish option. Today, we see a bearish pullback that pushes us to retest this support level. Too much pressure could lead to a breakout below and the formation of a new low dollar index. Potential lower targets are 103.80 and 103.60 levels.
Next week is Thanksgiving in the US, and the number of economic news will significantly reduce. Therefore, we can expect less market volatility during that period.


