USDCHF and USDJPI: USDJPI drops to the 149.30 level
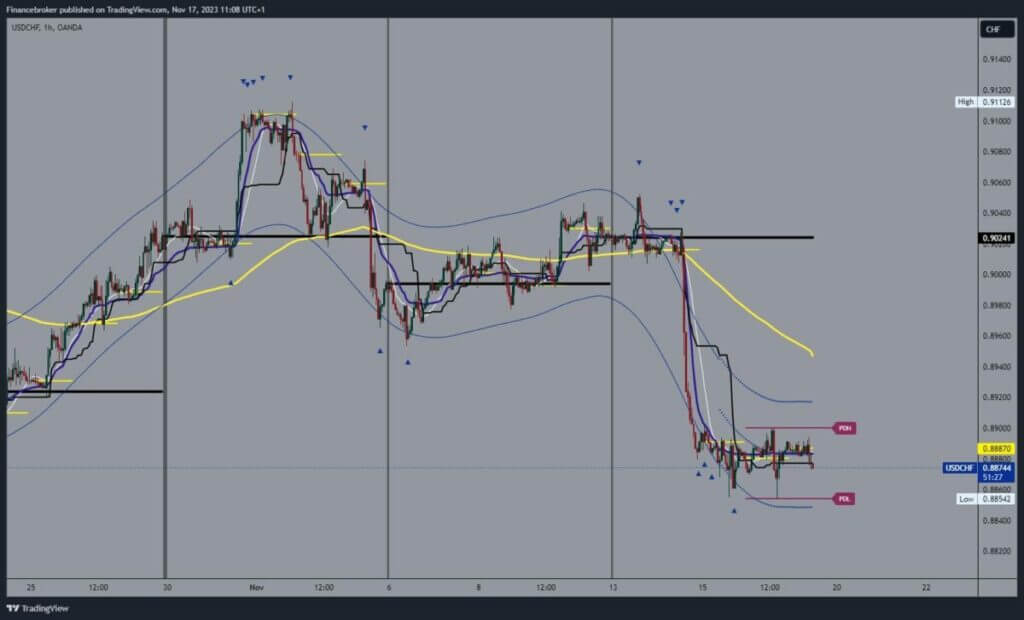
- The pair USDCHF did not withstand the bearish pressure at the 0.90200 level at the beginning of the week and was followed by a bearish drop to the 0.88542 level.
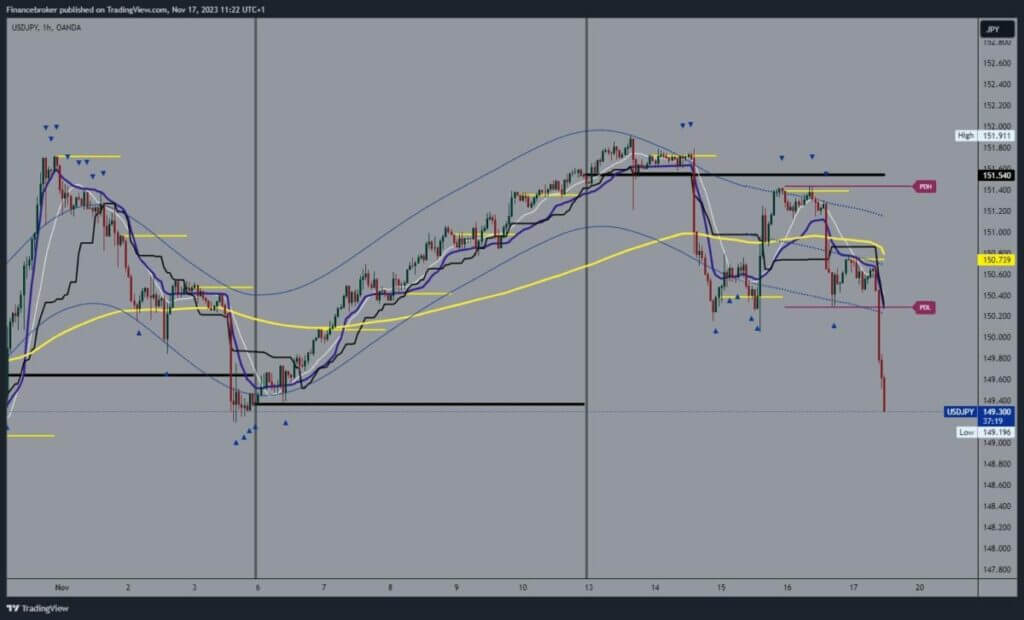
- The USDJPY pair is in a bearish trend, retreating from the 151.90 level.
USDCHF chart analysis
The pair USDCHF did not withstand the bearish pressure at the 0.90200 level at the beginning of the week and was followed by a bearish drop to the 0.88542 level. We are already in the 0.88600-0.8900 range for the third day, and the pair is still pressing the support zone. A breakout below and the formation of a new low could easily happen. Potential lower targets are 0.88400 and 0.88200 levels.
We need a positive consolidation and recovery above the 0.89000 level for a bullish option. Then, we would have to hold above there in order to form a new bottom from which to start a further recovery to the bullish side. Potential higher targets are 0.89200 and 0.89400 levels. In the zone around the 0.89400 level, we encounter the EMA50 moving average.

USDJPY chart analysis
The USDJPY pair is in a bearish trend, retreating from the 151.90 level. We saw a strong bearish impulse on Tuesday after reports of lower inflation compared to the previous month. The decline stopped at the 150.20 level, and we managed to hold above it and initiate a recovery to the 151.40 level. There, we encountered a new resistance, and yesterday, we made a new pullback now to the 150.40 level.
During the previous Asian trading session, the pair managed to stay above that level up to 150.80, where we encountered the EMA50 moving average, and later in the EU session, we saw the dollar fall and descend to 149.36 levels. A strong bearish impulse could further lower USDJPY, and potential lower targets are 149.20 and 149.00.


