Stabilizing Above $72: What Moves the Oil Price today?
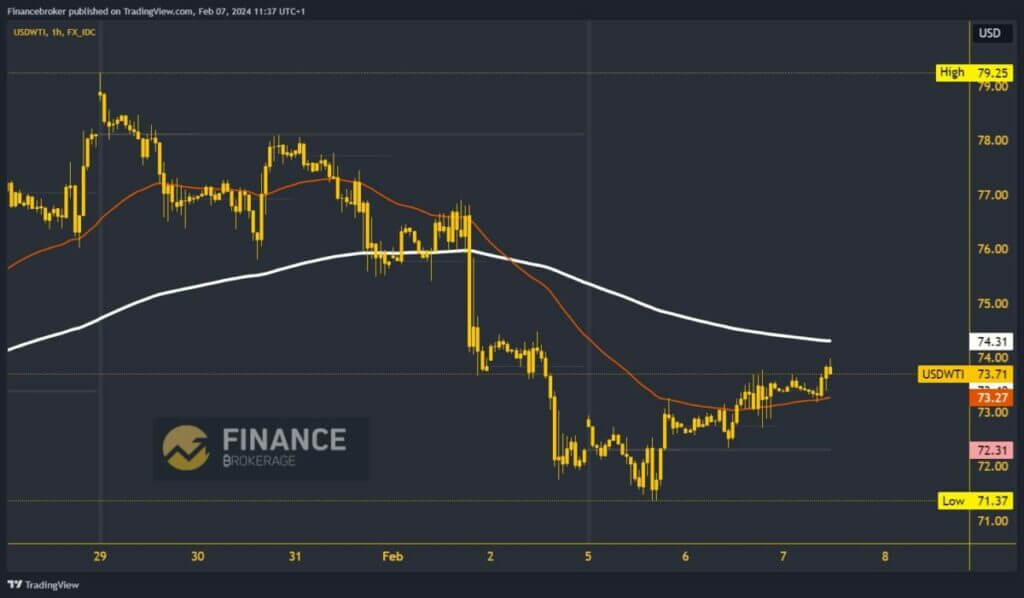
- The price of oil is in a bullish trend after falling on Monday to the $71.37 level.
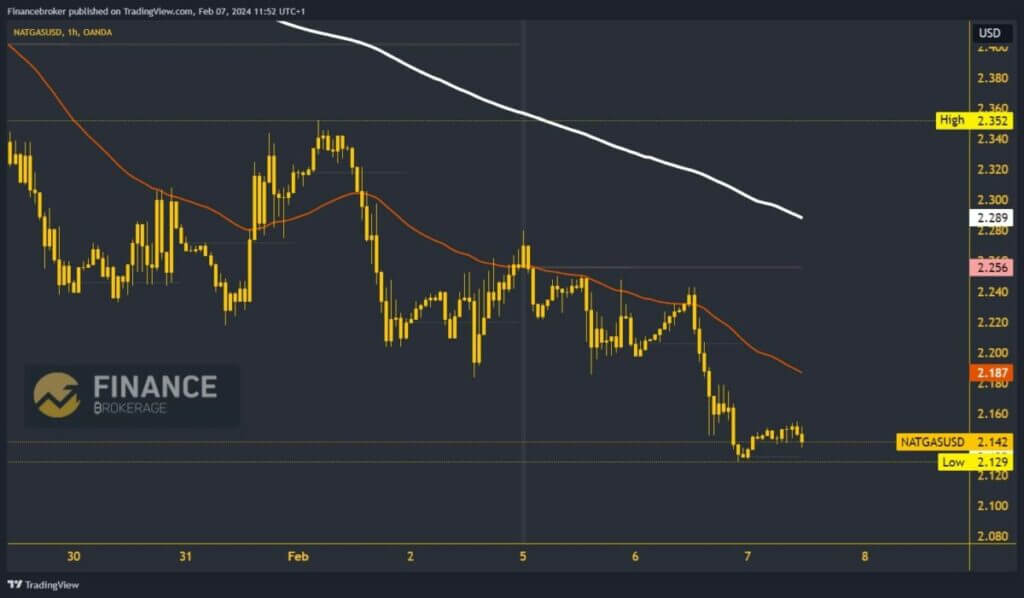
- The price of natural gas continued to retreat this week.
Oil chart analysis
The price of oil is in a bullish trend after falling on Monday to the $71.37 level. We quickly bounced back above $72.00 and successfully stabilized above. On Tuesday, the price climbed to the $73.00 level and successfully hovered around that level for most of the day. During this morning’s Asian trading session, the oil price received support at the $73.30 level and continued the previous bullish consolidation from there. This leads to the formation of today’s high price at the $74.00 level.
For now, we maintain below it and pull back to the $73.75 level. Potential higher targets are $74.50 and $75.00 levels. We will have additional pressure on the price of oil in the EMA200 in the zone around the $74.30 level. For a bearish option, we need a pullback of the oil price below $73.30, this morning’s support zone. With a drop below, we would form a daily price low, and the potential lower targets are $72.50 and $72.00 levels.

Natural gas chart analysis
The price of natural gas continued to retreat this week. This led us to see the formation of this year’s new low at the $2.12 level yesterday. During the previous Asian trading session, the price recovered slightly to $2.15, where we encountered new resistance. After resistance in that zone, we start a pullback with the view of retesting last night’s low. This could cause a breakout below and drop the price of natural gas to an even lower level.
Potential lower targets are $2.10 and $2.08 levels. We need a break above the $2.15 level for a bullish option. Then, we would have to hold up there to generate bullish momentum and start a recovery. Potential higher targets are $2.18 and $2.20 levels.


