USDCHF and USDJPY: USDCHF gains support at 0.86700 level
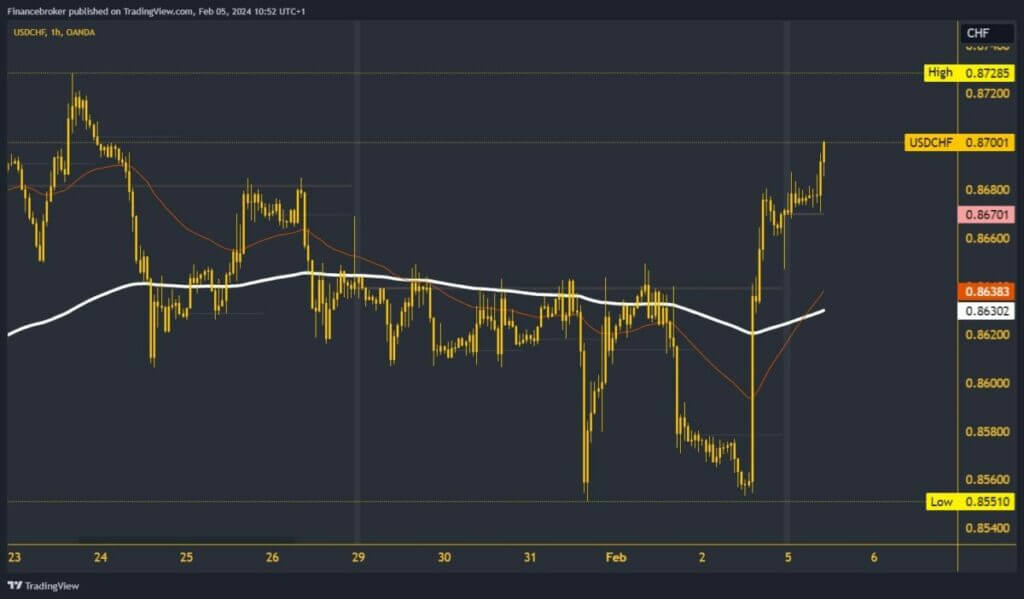
- On Friday, we watched the USDCHF climb with strong bullish momentum and erase all losses from previous days.
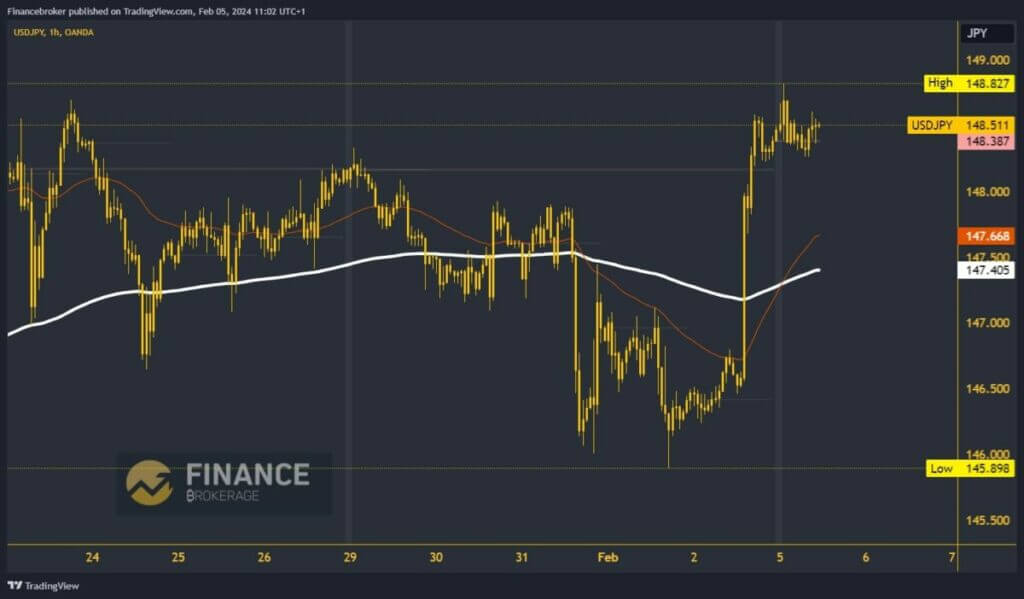
- Last week’s low USDJPY was formed at the 145,898 level; from that place, we started the current bullish consolidation.
USDCHF chart analysis
On Friday, we watched the USDCHF climb with strong bullish momentum and erase all losses from previous days. The pair climbed above the EMA200 moving average, forming a high at the 0.86800 level. During the Asian session, we successfully held above the 0.86700 level. This gave us confidence, and in the EU session, USDCHF is rising with a bullish impulse and is now on the verge of reaching the 0.87000 level. Potential higher targets are 0.87100 and 0.87200 levels.
We need a negative consolidation and pullback below this morning’s support at the 0.86700 level for a bearish option. A drop below would strengthen the bearish momentum on the dollar to start a further descent to lower levels. Potential lower targets are 0.86600 and 0.86400 levels. In the zone around 0.86300, additional support and an obstacle to further decline is the EMA200 moving average.

USDJPY chart analysis
Last week’s low USDJPY was formed at the 145,898 level; from that place, we started the current bullish consolidation. On Friday, we saw a 200 pips jump in favour of the dollar against the Japanese yen. During the previous Asian trading session, the pair rose with new momentum to a new high at the 148.82 level. After that, we are looking at the consolidation that continues now, and the pair goes down to the 148.50 level.
We remain very bullish, hoping to see a continuation of the bullish option. Potential higher targets are 149.00 and 149.25 levels. For a bearish option, we need a drop to the 148.00 level. There, the dollar would be under more pressure and could slide even lower in search of new support. Potential lower targets are 147.75 and 147.50 levels. Additional support and an obstacle to further decline will be found in the EMA200 moving average at the 147.40 level.


