Oil remains at $70.00, and natural gas drops to $2.34
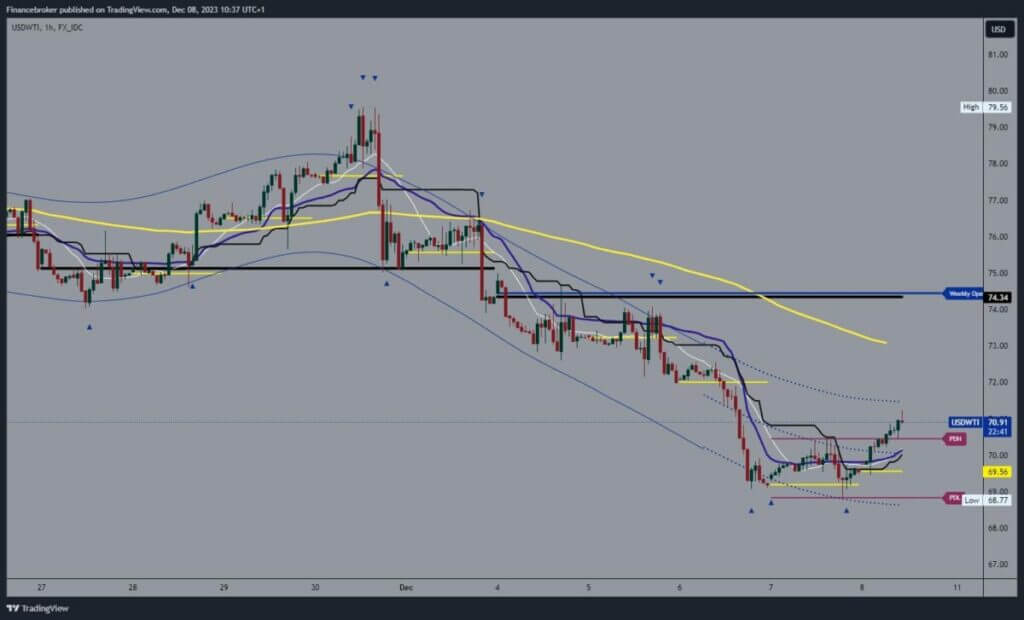
- The price of oil retreated to the $68.77 level yesterday.
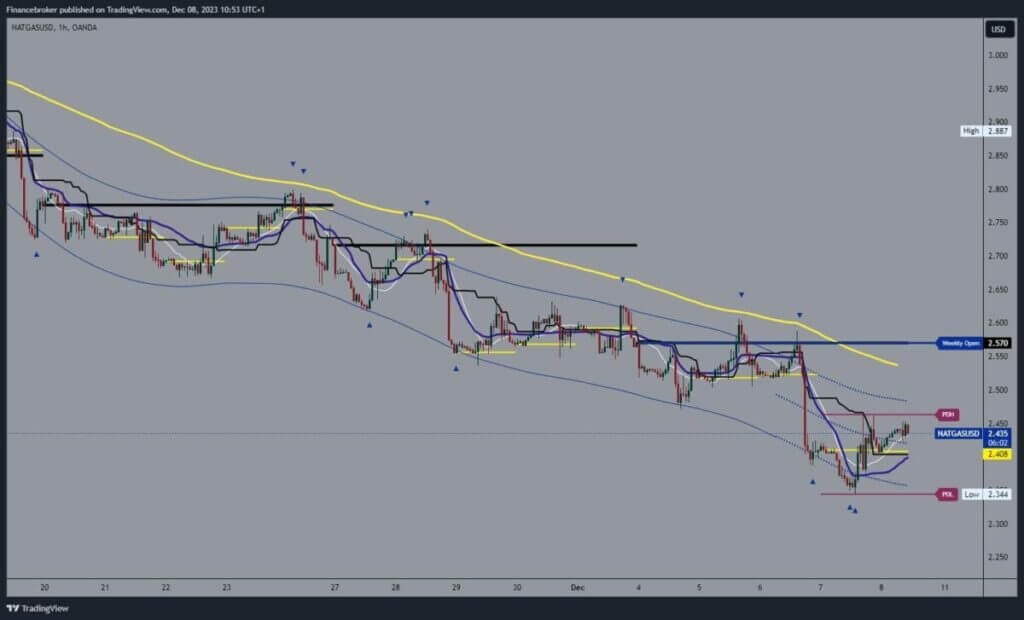
- The price of natural gas dropped to $2.34 yesterday, forming a six-month low.
Oil chart analysis
The price of oil retreated to the $68.77 level yesterday. Yesterday was spent consolidating in the $69.00-$70.50 range. Today, we see a breakout of the upper level and a price jump to the $71.00 level. We now need to hold above $70.50 to continue the recovery. Potential higher targets are $72.00 and $73.00 levels.
We would have additional pressure on the oil price in the EMA50 moving average and the zone around the $73.00 level. For a bearish option, we need a negative consolidation and a pullback of the price below the $69.00 level again. Thus, we would return to the support zone again, and we could see a breakout below and the formation of a new low. Potential lower targets are $68.00 and $67.00 levels.

Natural gas chart analysis
The price of natural gas dropped to $2.34 yesterday, forming a six-month low. We managed to get support at that level and initiate a recovery to the $2.46 level. We remain below it for now and are moving into consolidation in the $2.40-$2.46 range. We need a break above in order to get rid of the bearish pressure and start a continuation to the bullish side.
Potential higher targets are $2.48 and $2.50 levels. Additional price resistance could be found in the EMA50 moving average in the zone around the $2.52 level. We need a negative consolidation and a price drop below the $2.40 level for a bearish option. After that, we would be under pressure to retest the previous low. Potential lower targets are $2.34 and $2.32 levels.


