Gold falls to $2020, and silver below the $24.00 level
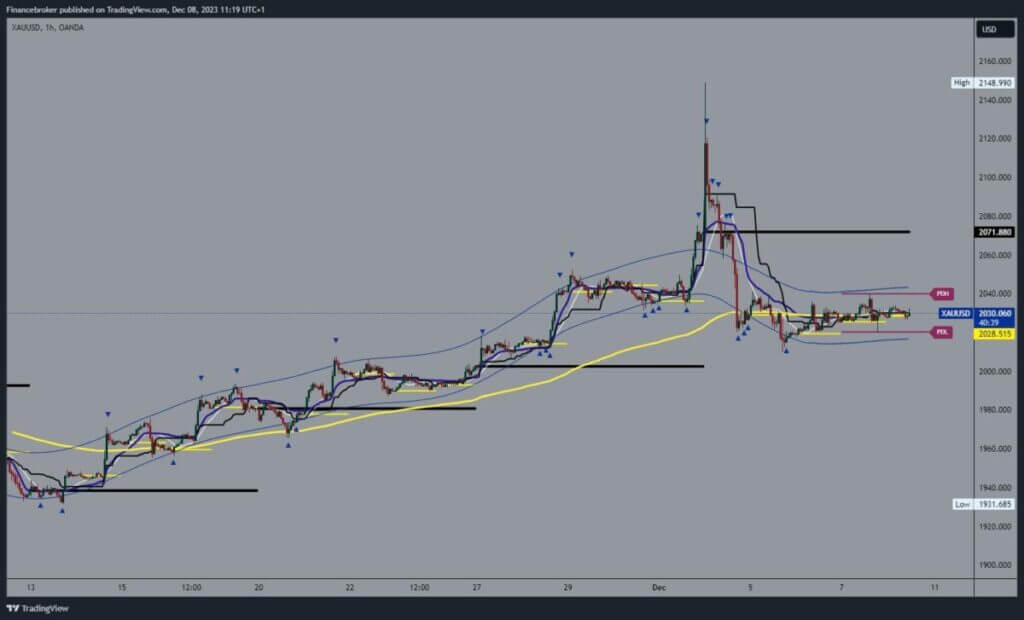
- On Monday, the price of gold jumped to the $2149 level and thus formed an ATH.
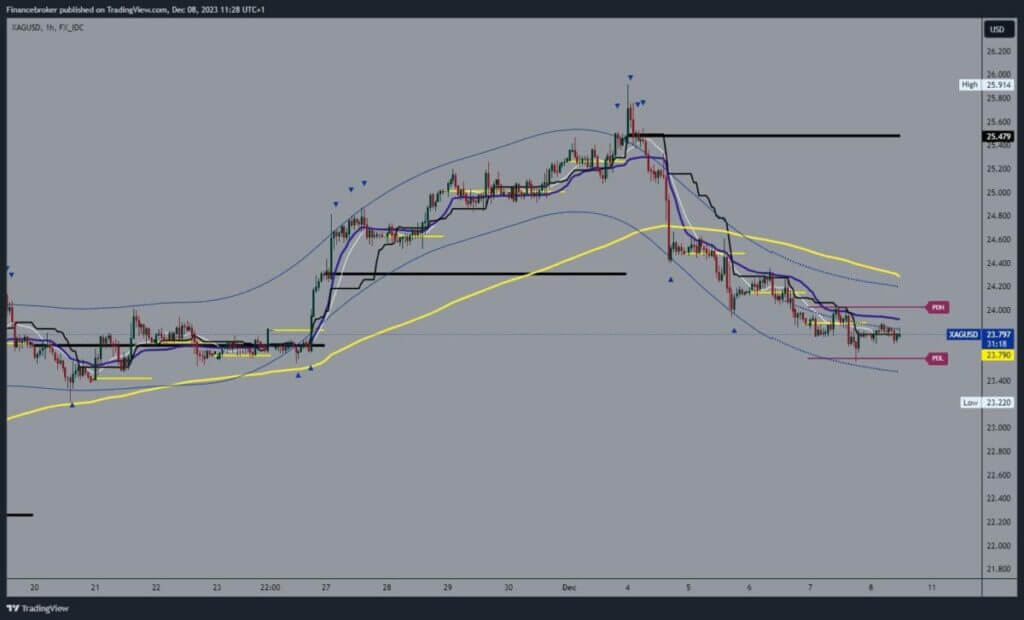
- Ignoring the jump in the price of silver on Monday to the $25.91 level, the movement was on the bearish side, with the formation of a low at the $23.60 level.
Gold chart analysis
On Monday, the price of gold jumped to the $2149 level and thus formed an ATH. From that moment, we start a pullback, which lowers the price to the $2009 support level. We get that support and continue to date with a sideways consolidation in the $2020-$2040 range. The company creates an EMA50 moving average for us in the middle of this channel at the $2030 level. The current price is below the level, and we can expect some stronger impulse during the NFP report.
We need to jump above the $2040 level for a bullish option. Then we also need to keep up there. After that, we need a new bullish impulse to trigger further recovery. Potential higher targets are $2050 and $2060 levels. For a bearish option, we need a negative consolidation and pullback below the support at the $2020 level. With the drop below, we will once again have the opportunity to test this week’s low. Potential lower targets are $2000 and $1990 levels.

Silver chart analysis
Ignoring the jump in the price of silver on Monday to the $25.91 level, the movement was on the bearish side, with the formation of a low at the $23.60 level. The price fell to $24.40 on the same day, thus deleting almost the entire gain from the previous week. We had additional pressure when we fell below the EMA50 moving average. This caused the price of silver to drop to the $23.60 level yesterday. Today’s movement is around $23.80, but we are still very close to the support zone.
This could easily lead to a breakout below and the formation of a new low. Potential lower targets are $23.40 and $23.20 levels. We need a positive consolidation and a move above the $24.00 level for a bullish option. After that, we pay attention to the $24.20 level because we encounter the EMA50 there, and we need a break above it for a further break to the bullish side.


