The dollar index took a step back below 105.50 yesterday
- This week, the dollar index was in a bullish consolidation until yesterday, stopping at 105.74
Dollar index chart analysis
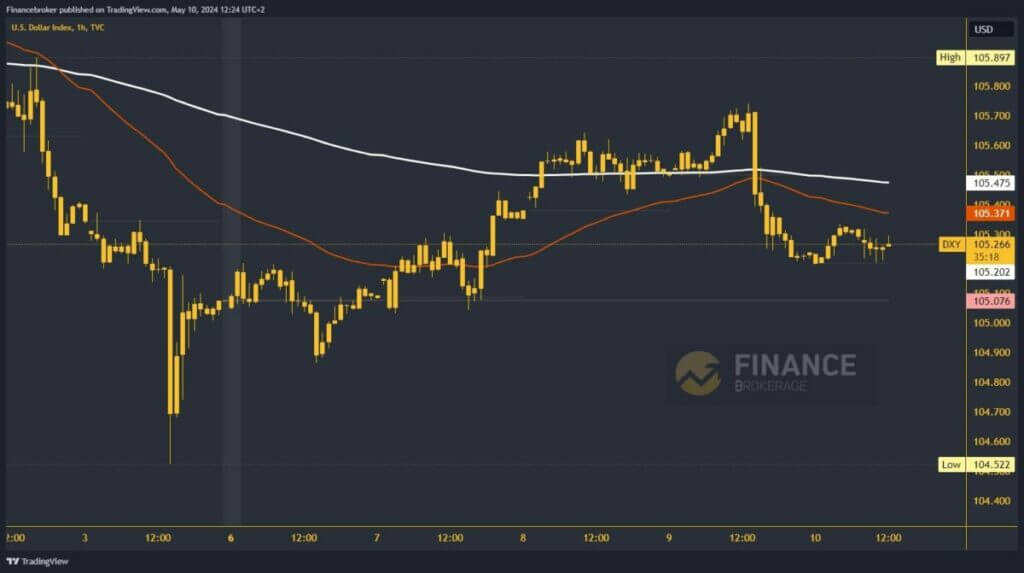
This week, the dollar index was in a bullish consolidation until yesterday, stopping at 105.74. A strong bearish impulse followed, leading to a pullback. The index dropped to 105.40 and fell below the EMA200 moving average. By the end of the day, the retreat continued to the 105.20 level.
During this morning’s Asian trading session, the index remained above the support level and recovered to the 105.30 level. However, it has not managed to move above this level and is currently moving in the 105.20-105.30 range. This could potentially increase the pressure on the dollar to slide below to a new daily low, with potential lower targets at 105.10 and 105.00 levels.

Pulling back below 105.00, is there dollar strength to move back above?
For those considering a bullish option, there is potential for a recovery if we manage to move above the 105.30 level and sustain that position. This could open up the opportunity for a further recovery on the bullish side, with potential higher targets at 105.40 and 105.50 levels. It’s important to monitor the EMA200 moving average in the zone of 105.50 levels for any potential shifts.
While there are no significant news events for the dollar today, it’s important to note the following: FOMC Member Bowman Speaks, Michigan Consumer Sentiment, Fed Goolsbee Speaks, Fed Vice Chair for Supervision Barr Speaks, and Federal Budget Balance. Looking ahead to next week, there is also a lower volume of very important news. We highlight the following: German CPI, American CPI, Japanese GDP and Eurozone CPI.


