Oil and Natural Gas: Price moved slightly lower
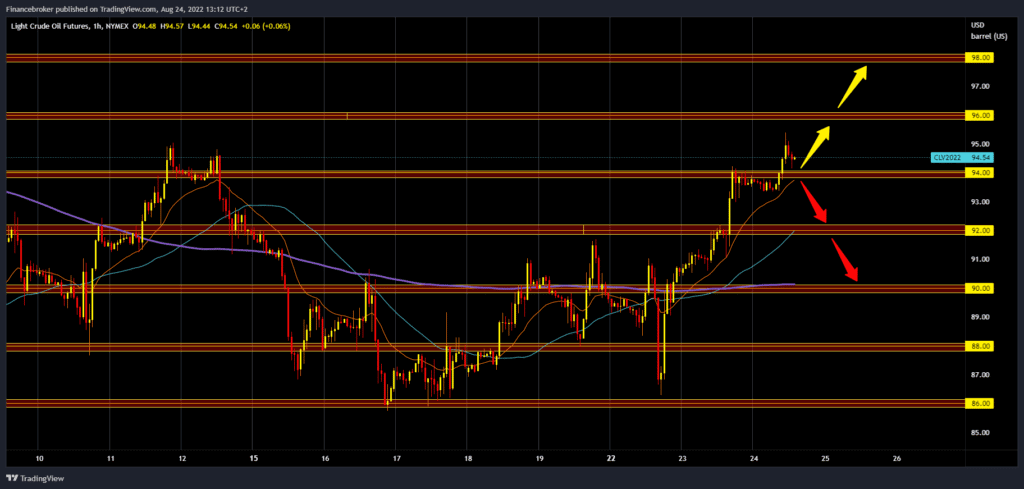
- The price of oil continues its bullish trend from yesterday after finding support at the $92.00 level.
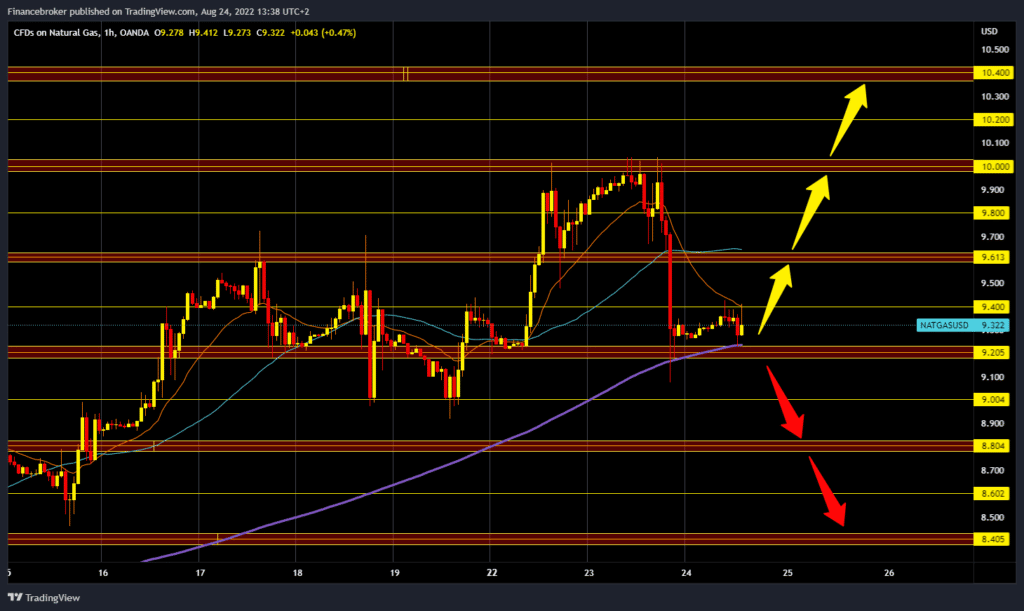
- The price of natural gas failed to maintain the $10.00 level.
- The American Petroleum Institute reported a big draw for crude at 5.632 million barrels on Tuesday.
Oil chart analysis
The price of oil continues its bullish trend from yesterday after finding support at the $92.00 level. We saw a bullish impulse that took us up to the $94.00 level, and we stayed in that zone until the end of the day. During the Asian trading session, the price of oil moved slightly lower to $93.35. Once again, a bullish impulse followed, which raised the price to the $95.40 level. We are now at the $94.00 level and looking for support to try to continue towards the $96.00 resistance level. Potential higher targets are $97.00 and $98.00 levels. For a bearish option, we need a negative consolidation and a break below $94.00, today’s support level. Additional potential support for us at that point is in the MA20 moving average. Potential lower targets are $93.00 and $92.00 levels. Additional support at that level is in the MA50, while the MA200 is in the zone of around $90.00.
Natural gas chart analysis
The price of natural gas failed to maintain the $10.00 level, and a pullback to the $9.00 level followed. We then see a minor recovery above the $9.20 level. During the Asian trading session, the price of gas moved in the range of $9.20-$9.40. We need a new positive consolidation and a break above the $9.40 level for a bullish option. After that, we need to stay above in order to continue towards the next higher target. Potential higher targets are $9.60, $9.80 and $10.00 levels. At $9.60, additional resistance and obstacle are in the MA200 moving average. For a bearish option, we need a continuation of yesterday’s negative consolidation and a pullback of the price below the $9.20 level. Potential lower targets are $9.00 and $8.80 levels.
Market Overview
The American Petroleum Institute reported a big draw for crude at 5.632 million barrels on Tuesday, which was more than expected. US crude oil inventories have fallen by about 67 million barrels since the start of 2021. The API also reported a slight increase in gasoline inventories this week of 268,000 barrels.


