Oil and Natural Gas: Oil slipped to $72.13 yesterday
- At the beginning of this week, we saw the price of oil attempt to climb to the $80.00 level
- All this week, the price of natural gas has struggled to stay above the $3.00 level.
Oil chart analysis
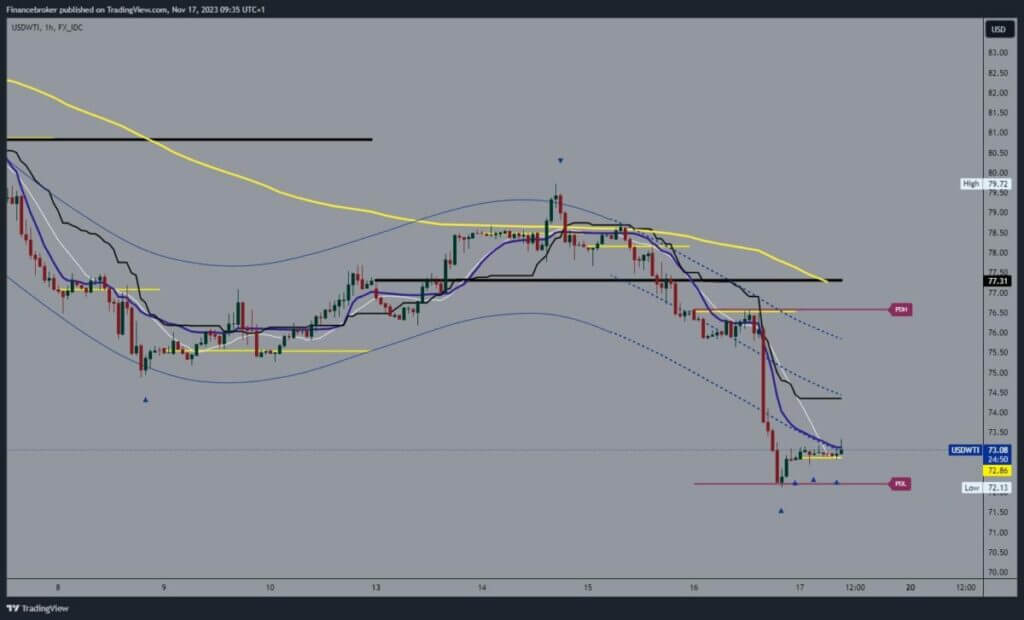
At the beginning of this week, we saw the price of oil attempt to climb to the $80.00 level. The price failed and stopped at the $79.72 level. We had additional pressure in that zone in the EMA50 moving average, which did not allow us to stay above it. After that, a bearish consolidation followed, and the oil price retreated. Yesterday, we tried to stop the fall to $76.00, but great pressure made us see a breakthrough below, and the price dropped to $72.13.
There, we get new support and manage to stop the drop in oil prices. During the previous Asian trading session, we saw movement around the $73.00 level, and for now, we are successfully breaking above that level. We COULD expect the price to start a further recovery and erase part of the losses from the previous decline. Potential higher targets are $74.00 and $75.00 levels.

Natural gas chart analysis
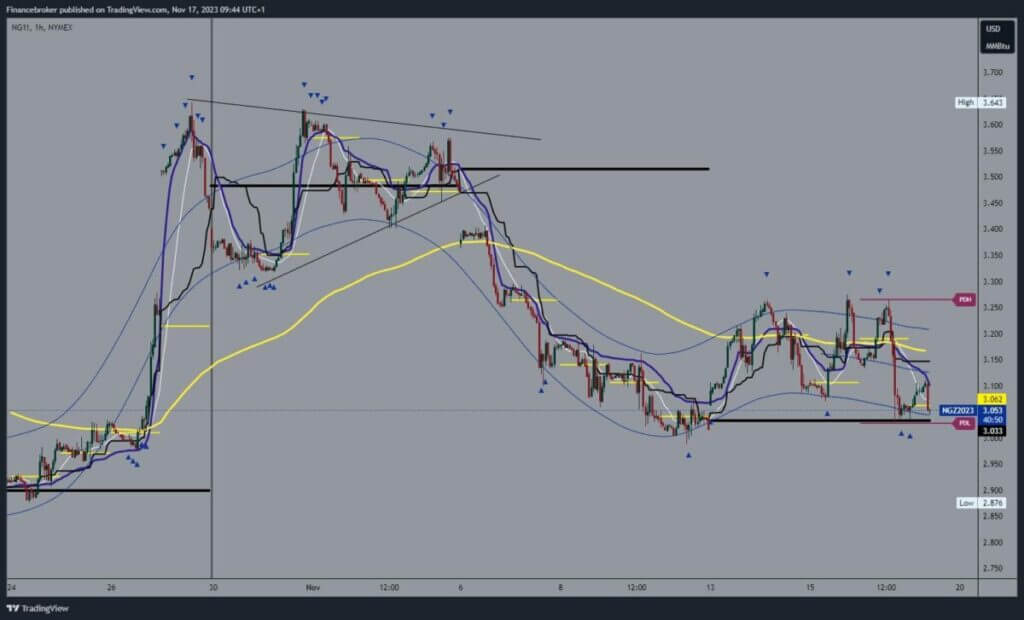
All this week, the price of natural gas has struggled to stay above the $3.00 level. We had three attempts to break away from this zone but always returned to it. Our resistance was the $3.25 level, along with the EMA50 moving average. The previous drop happened yesterday, after which the price is trying to recover to $3.10. Now, at this level, we encounter an open and again see a drop in the zone around the $3.00 level.
Increased pressure in this zone could lead to a breakout below and the formation of a new price low. Potential lower targets are $2.95 and $2.90 levels. We need a new positive consolidation and a price jump to the $3.20 level for a bullish option. Then, we would have to hold above there so that we would have a new opportunity to test the $3.25 resistance level. Potential higher targets are $3.30 and $3.35 levels.


