Gold and Silver: New Lower Low on a Larger Time Frame
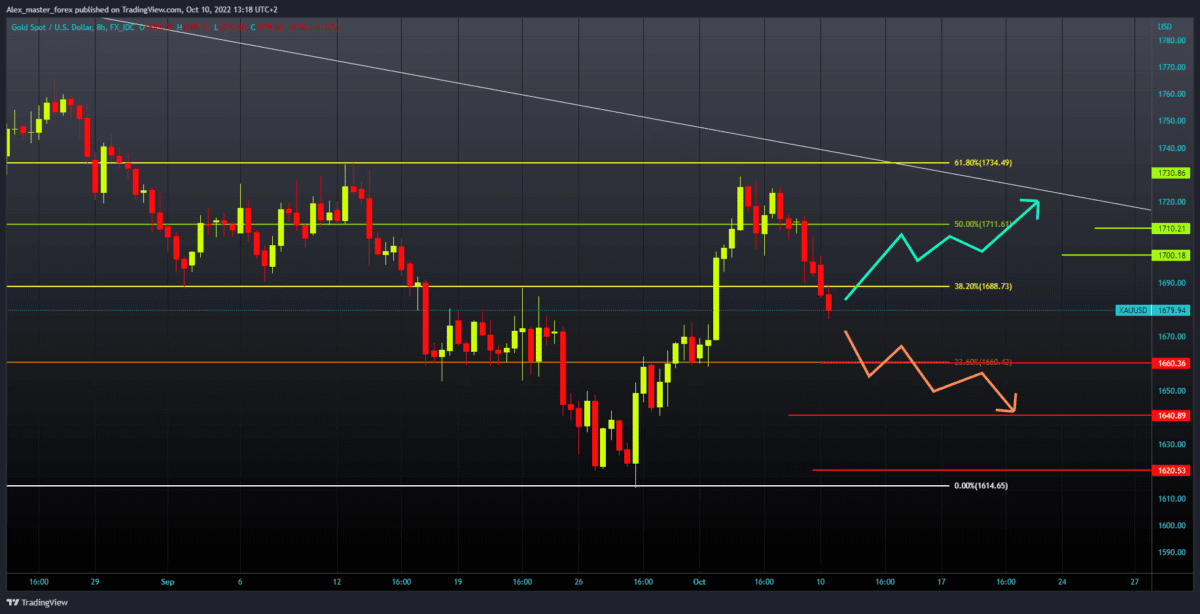
- The price of gold continues its bearish trend that started last week after we climbed to the $1730 level, forming a new lower low on a larger time frame.
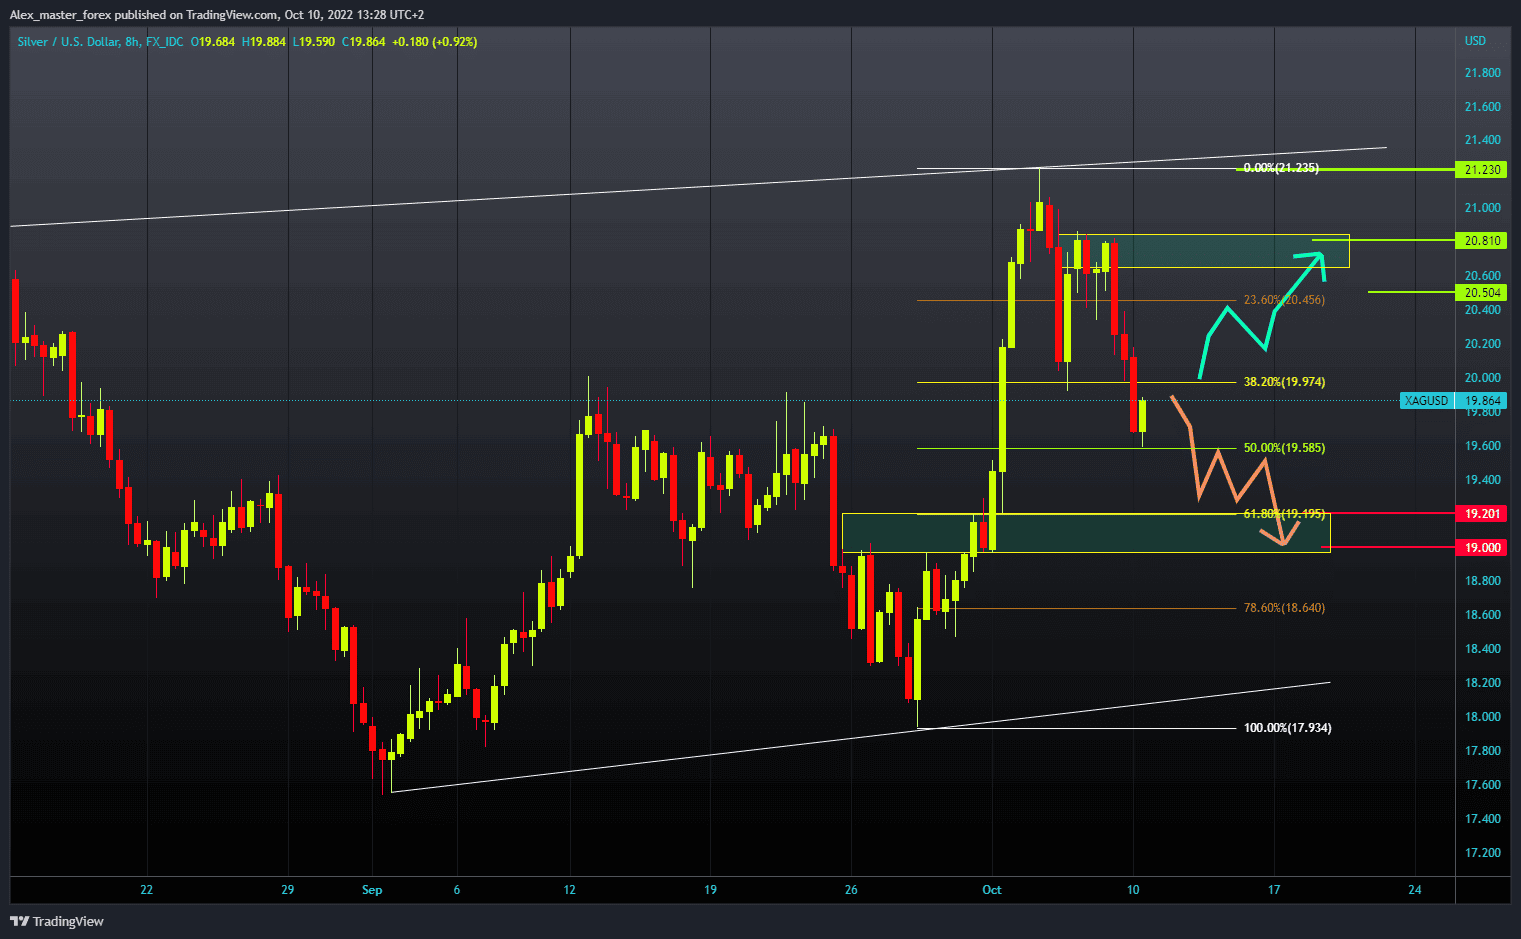
- After forming last week’s high at $21.23, the price of silver has been in a bearish trend since then.
Gold chart analysis
The price of gold continues its bearish trend that started last week after we climbed to the $1730 level, forming a new lower low on a larger time frame. During the Asian trading session, gold prices continued to retreat. Today’s low was at $1676, where we have an immediate hold for now. The price of gold could soon drop to the potential support zone of $1660-$1670.
If the price does not find support there, we will see a further decline to the previous low at the $1640 level. And if the dollar strengthens, gold could fall to $1,620 and once again look for support at the two-year low. For a bullish option, we need a new positive consolidation and a return above the $1690 level at the $38.2 Fibonacci. Then we must hold above and continue the recovery with a new bullish impulse. Potential higher targets are $1700 and $1710 at 50.0% Fibonacci.
Silver chart analysis
After forming last week’s high at $21.23, the price of silver has been in a bearish trend since then. With the Fibonacci setup, we can measure pullbacks. The first was stopped at the 38.2% level, then we see a recovery to $20.80, but not the formation of a new higher high. The price of silver is making a new pullback which was stopped today at the 50.0% Fibonacci, and we now have some support here at $19.60. Silver prices are recovering again to $19.90, and we are now following this bullish impulse to see where the next high will be.
The formation of a new lower high is a sign of a further weakening of the price of silver, and our potential target is the 61.8% Fibonacci level, the support zone of $19.00-$19.20. For a bullish option, we need a continuation of the current momentum and a price jump again to the $20.80 resistance level. A break above would greatly benefit us for a potential continuation of the price recovery. The next target is last week’s high at $21.23 level.