EURUSD and GBPUSD: 61.8% Fibonacci level
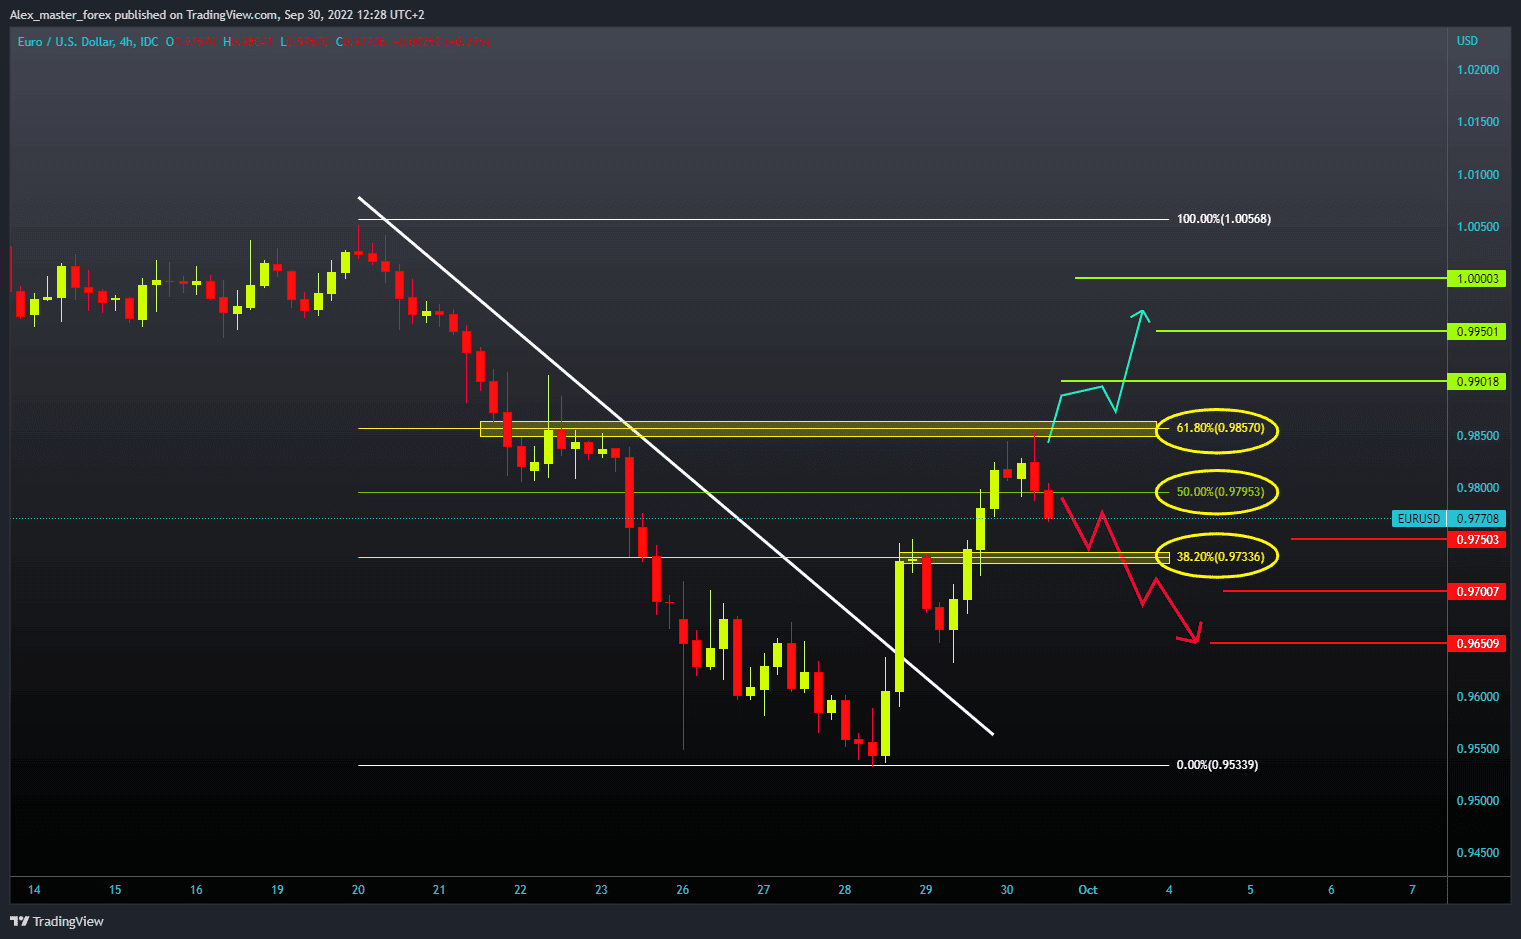
- During the Asian trading session, the EURUSD pair encountered resistance in the 0.98500 zone at the 61.8% Fibonacci level.
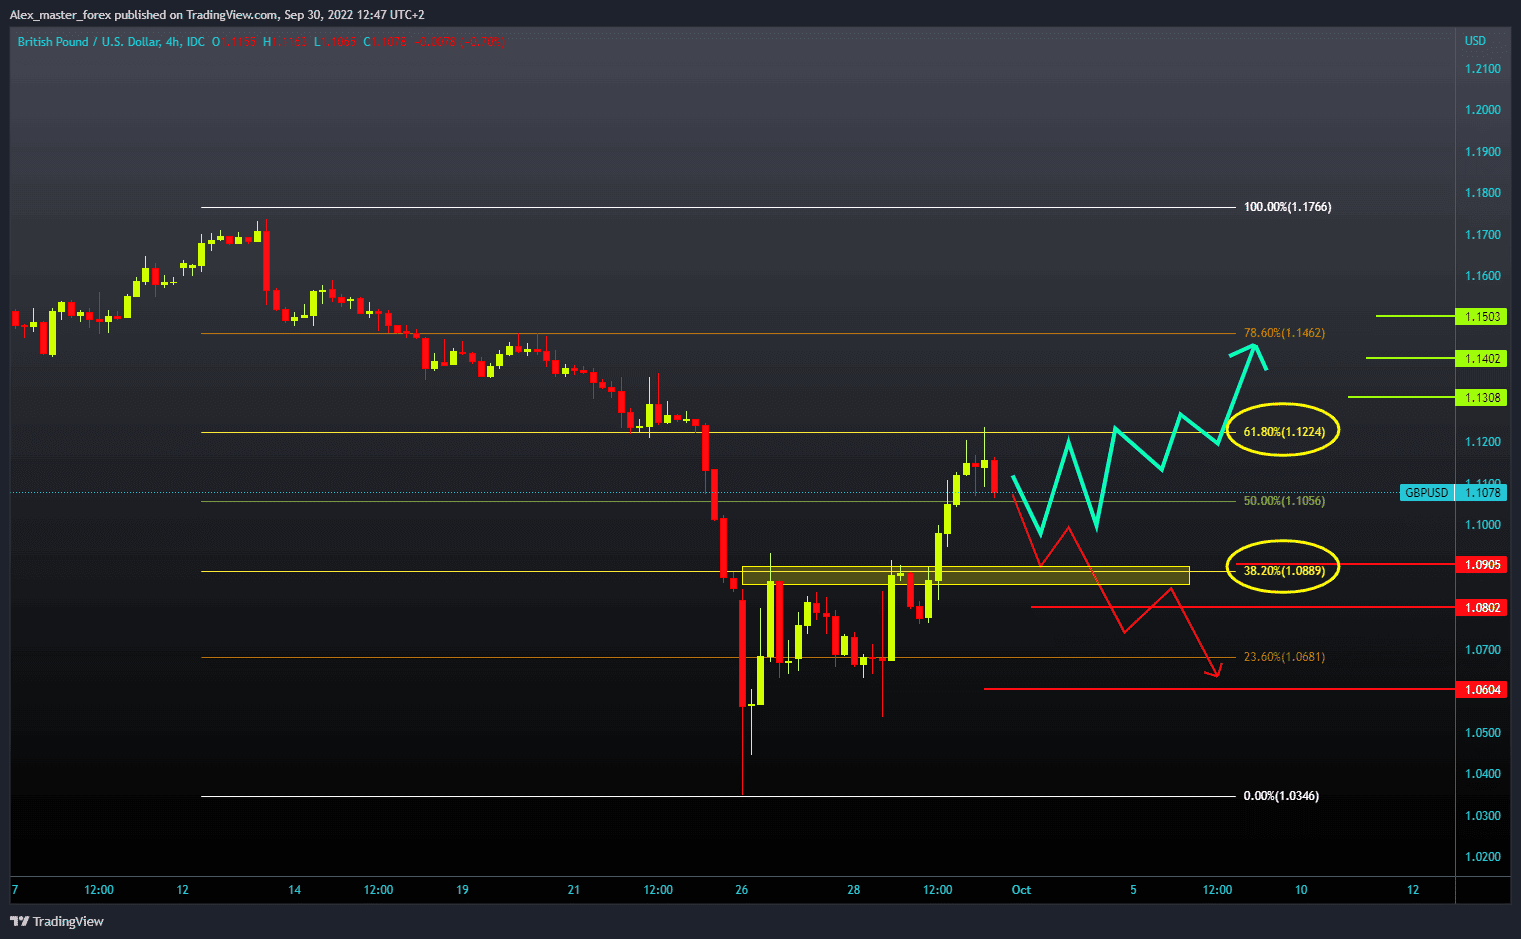
- Pair GBPUSD was stopped at 1.12240 at 61.8% Fibonacci.
EURUSD chart analysis
During the Asian trading session, the EURUSD pair encountered resistance in the 0.98500 zone at the 61.8% Fibonacci level. This was followed by a pullback to 0.98000 at the 50.0% Fibonacci level. EURUSD could further decline to the 38.2% Fibonacci level, where it would test the breaking point. If we find new support there, the pair will form a higher low, and we could start a new bullish impulse. After that, we should see a new positive consolidation and new testing of the 0.98500 level. A break above the euro could signal a continuation of the recovery. Potential higher targets are 0.99000, 0.99500 levels. For the bearish option, we need a negative consolidation up to the 38.2% level, then a break of the euro below. The pair could then descend to test the support at the 0.965000 level. A potential lower target is the 0.9550 level.
GBPUSD chart analysis
Pair GBPUSD was stopped at 1.12240 at 61.8% Fibonacci. Now we see a pullback to 1.10500 at 50.0% Fibonacci, and if a break occurs below, our target is the support level at 1.09000 at 38.2% Fibonacci. There we could find support for the next bullish impulse. Then we need to return to the resistance zone at the 1.12000 level. However, we should make a break above and try to hold up there. A new bullish impulse could move us towards the next resistance zone. Potential higher targets are 1.13000 and 1.14000 levels. For a bearish option, we must first go down to the 38.2% Fibonacci at the 1.09000 level. A break below would signal that the pound is weak, and we could see it at lower levels. Potential lower targets are 1.08000 and 1.06000 levels.