Ethereum analysis for March 30, 2021
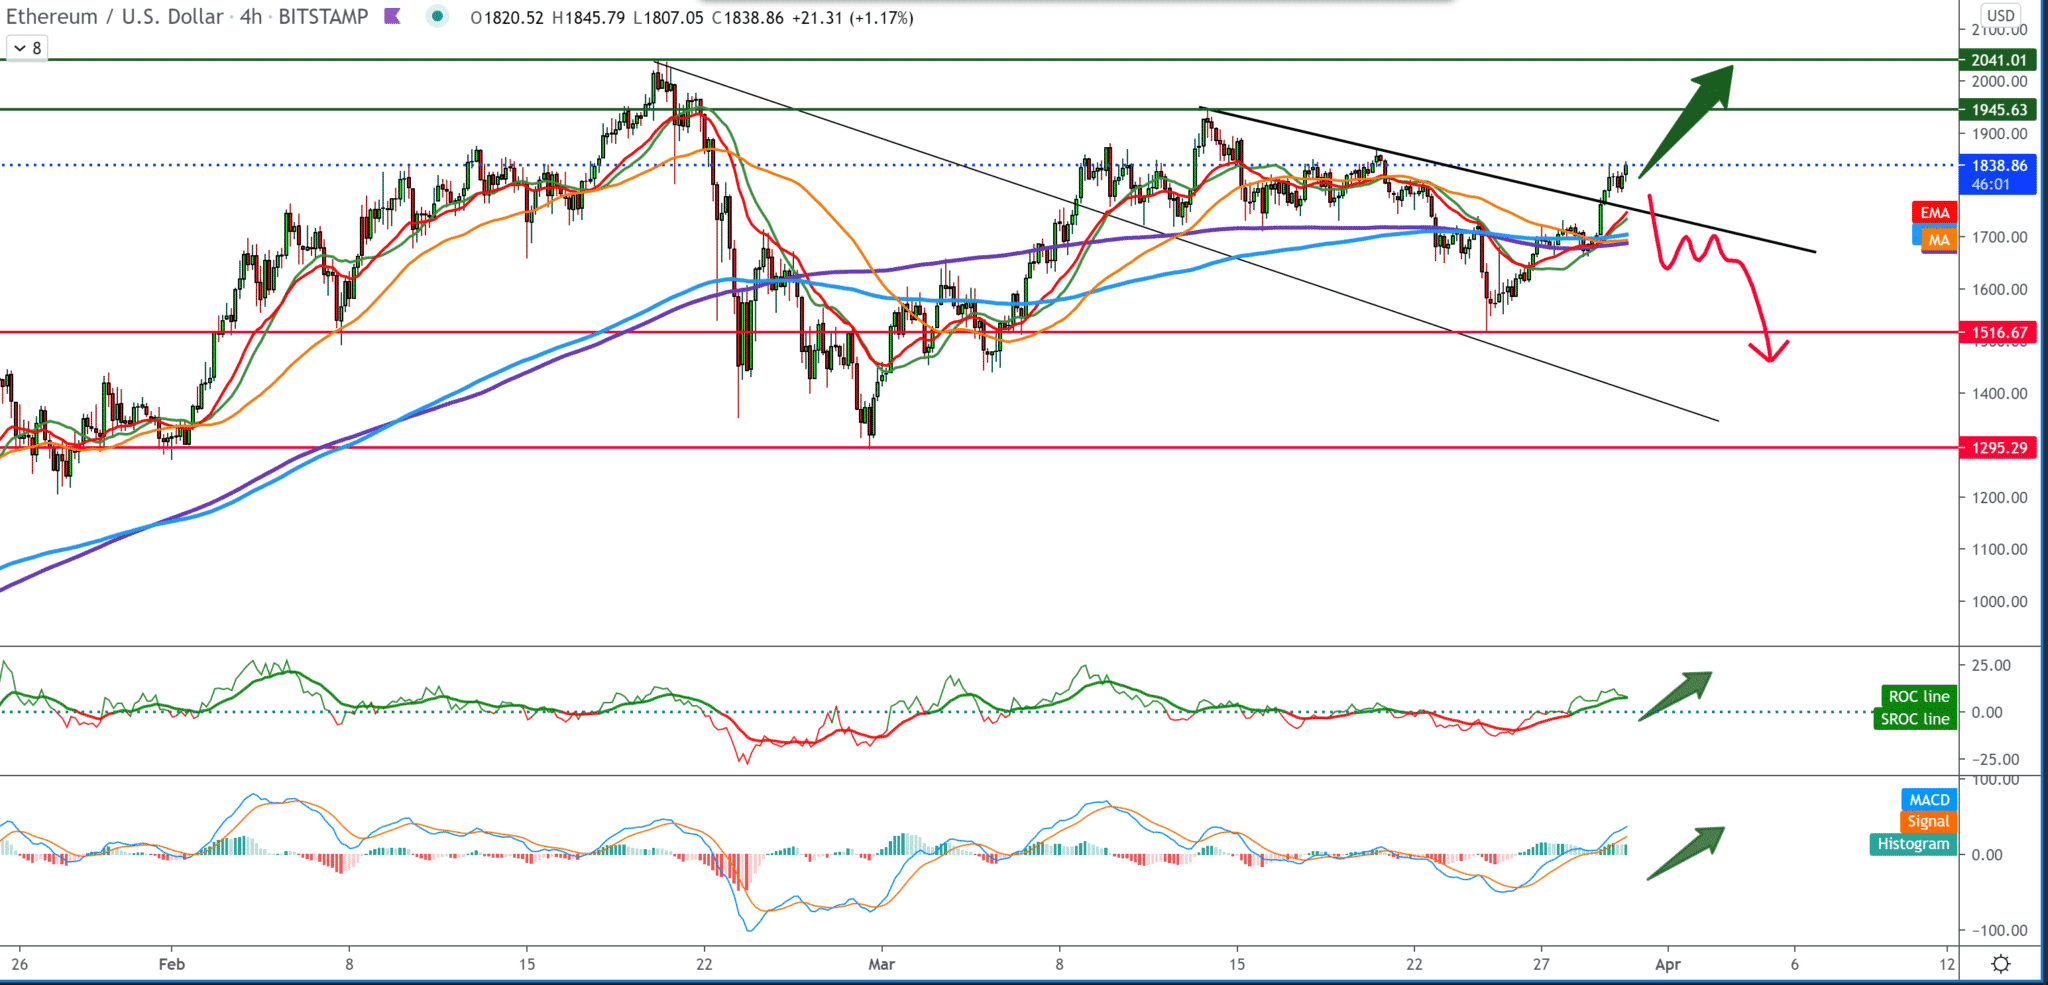
If we look at the four-hour chart, we will see that Ethereum made a break above the resistance line and is now at $ 1830. After the break, we also got the support of moving averages from below. Our next target is the previous high at $ 1945 before we approach the $ 2000 zone again. There are currently no bearish characters on the chart, and for now, we are going up.

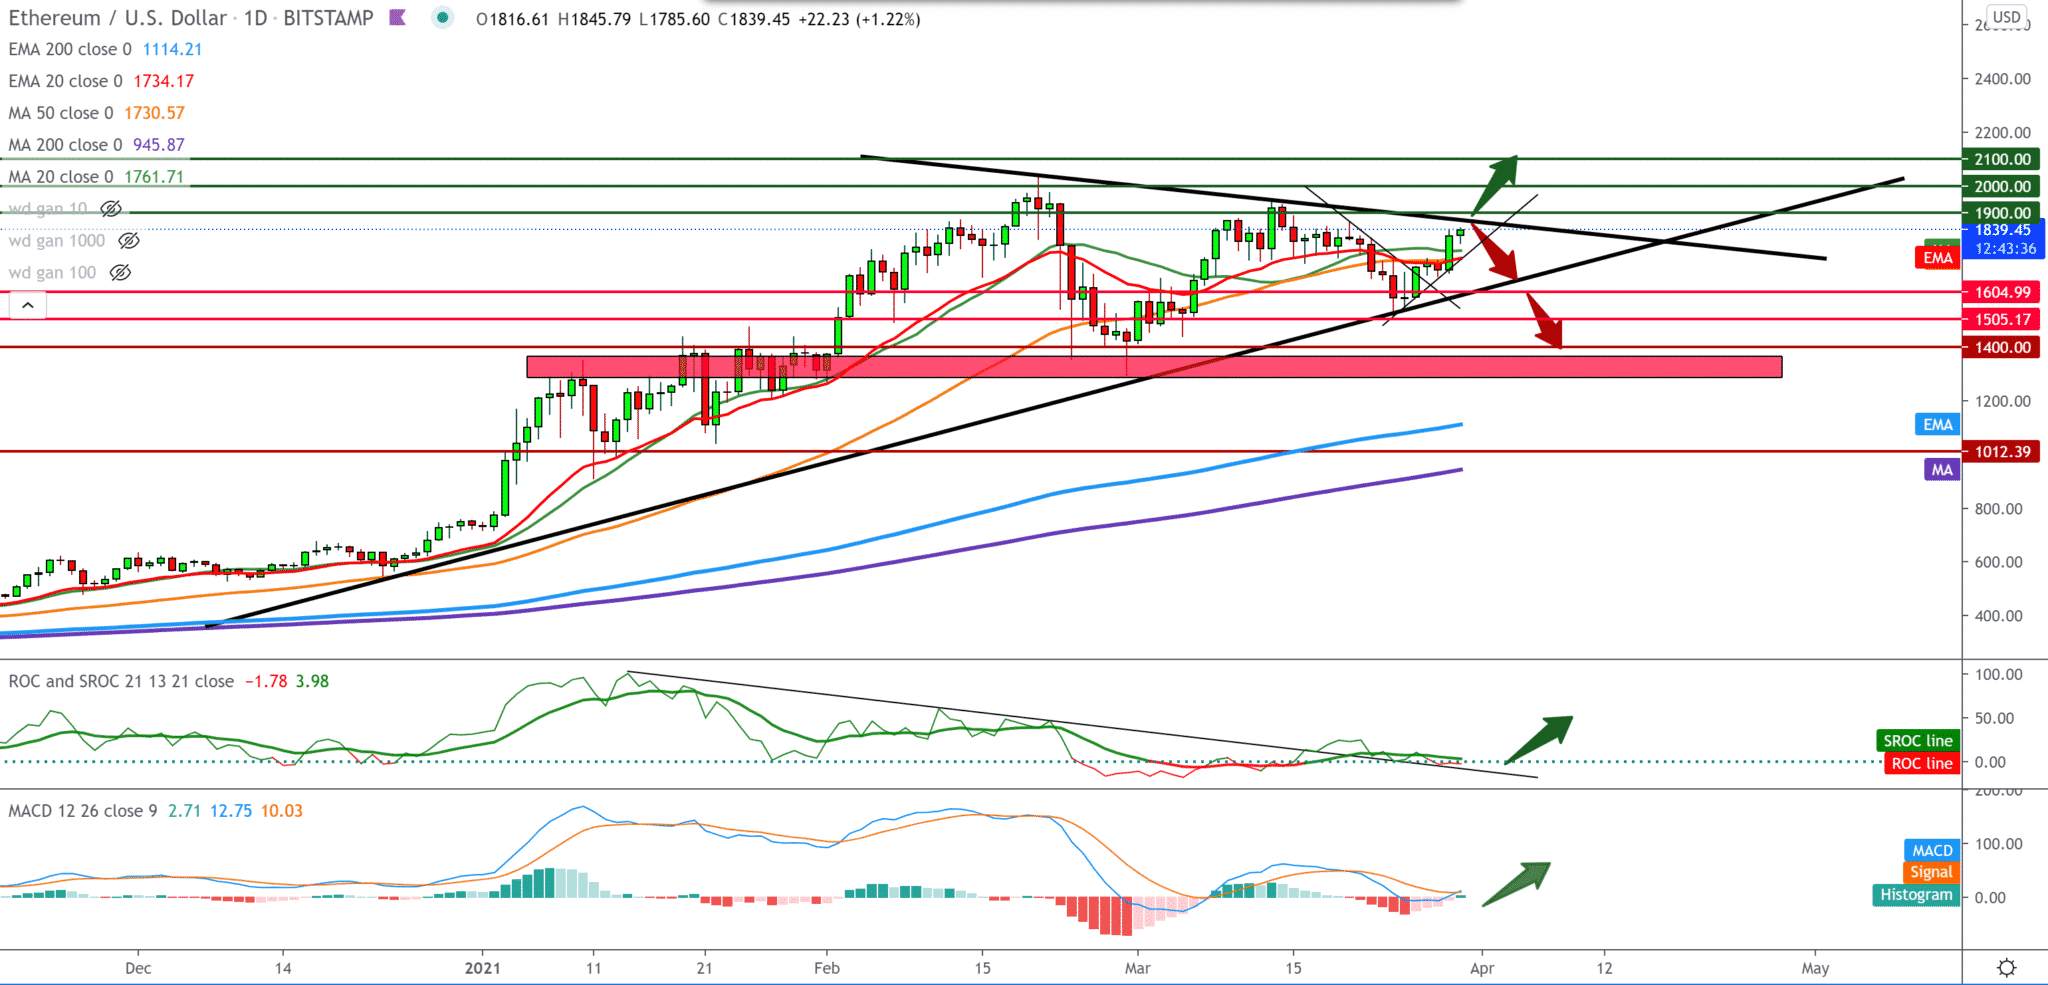
In the daily time frame, we see how Ethereum has climbed to the top line of this triangle and that here we can now expect some resistance. Moving averages are on the bullish side and support Ethereum. If we see a break outside the triangle, then we look towards $ 2000 as the next target.Although vague from a technical point of view, IntoTheBlock’s Price Input / Output (IOMAP) model suggests a bullish outlook due to the lack of impending resistance barriers. The stable support barriers reinforce this present just below.

The IOMAP cohort reveals 490,000 addresses that bought 12.05 million ETH present around $ 1,723. All short-term bear jumps will be absorbed by investors in the area, resulting in a jump. Failure to cross the upper trend line or refuse to resist the state MRI trend at $ 1,818 could lead to a withdrawal. If this move breaks below $ 1,588, it would disable the bull’s perspective and trigger the bear.
In this case, the price of Ethereum will first face the support of MRI for the state trend of 1,515 dollars. After violating this level, ETH could find support at $ 1,427, matching the MA200 on the four-hour time frame.
-
Support
-
Platform
-
Spread
-
Trading Instrument


