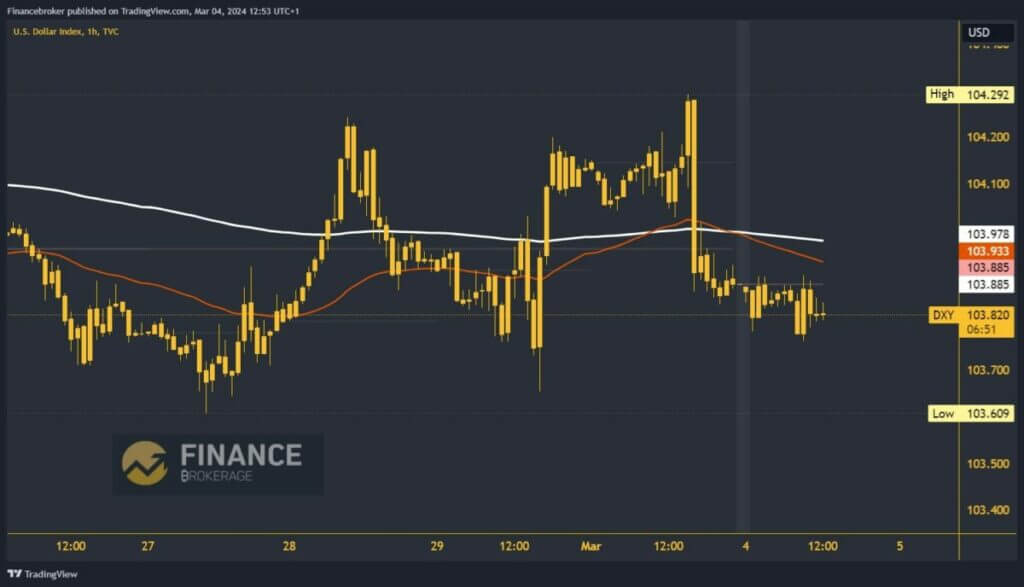
Dollar index under pressure at 103.80 at Monday’s open
- On Friday, we watched the dollar index attempt to climb to a new high above 104.30, but it stopped at the 104.29 level.
Dollar index chart analysis
On Friday, we watched the dollar index attempt to climb to a new high above 104.30, but it stopped at the 104.29 level. We stop there, and with a bearish impulse, we fall below the 104.00 level and the EMA200 moving average. Downward pressure increased on the dollar, which fell to 103.88 by the end of the day. With this step, we are back in a large potential support zone.
During this morning’s Asian trading session, the dollar slipped to a new weekly low of 103.75, thus confirming bearish dominance. Now, we are waiting for the US session, which could increase the dollar’s volatility and trigger a certain impulse. Potential low targets are 103.70 and 103.60 levels.

Did the dollar have the strength to get back above 104.00, or are we looking at a drop to lower levels?
If we were to stabilize above 103.90 and reach the 104.00 level, then we would form a bottom from which we could more easily start growing on the bullish side. We also get support from the EMA200 moving average, expecting it to push on and initiate a new impulse. Potential higher targets are 104.10 and 104.20, last week’s resistance levels.
This week, we will have a lot of important economic news that could affect the market’s movement. The most important are the EBC decision and the interest rate on Thursday. The Bank of Canada will do the same with its interest rate the day before. We highlight Fed Chairman Jerome Powell’s speeches on Wednesday and Thursday from the US market. And finally, on Friday, we have the NFP, the report, and the US unemployment rate for February.


