AUDUSD Pullback Below 1.06000, AUDNZD in a bearish trend
- During this week, AUDUSD has been on the bullish side.
- AUDNZD is in a bearish trend after climbing to 1.07034 levels last Friday.
AUDUSD chart analysis
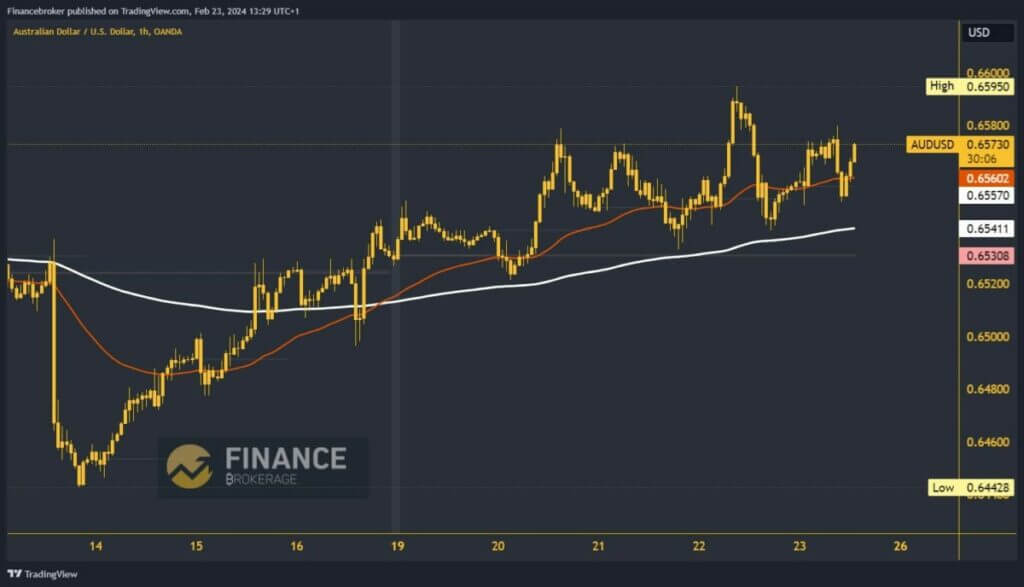
During this week, AUDUSD has been on the bullish side. After consolidation on Monday around the 0.65400 level, we saw a breakthrough above 0.65500 and a more concrete continuation on the bullish side. On Thursday, the pair rises to the 0.65950 level, forming a new weekly high. Then, we saw a pullback to the 0.65400 level, where we found support and started a resistance to the 0.65800 level.
During the previous Asian trading session, AUDUSD fell to the 0.65500 level, thus forming a higher low and confirming the bullish trend. Now, we are again on the way to the 0.65800 level, and we expect to test it by the end of the day. Depending on the momentum, a break above and the formation of a new daily high could occur. Potential higher targets are 0.65900 and 0.66000 levels.

AUDNZD chart analysis
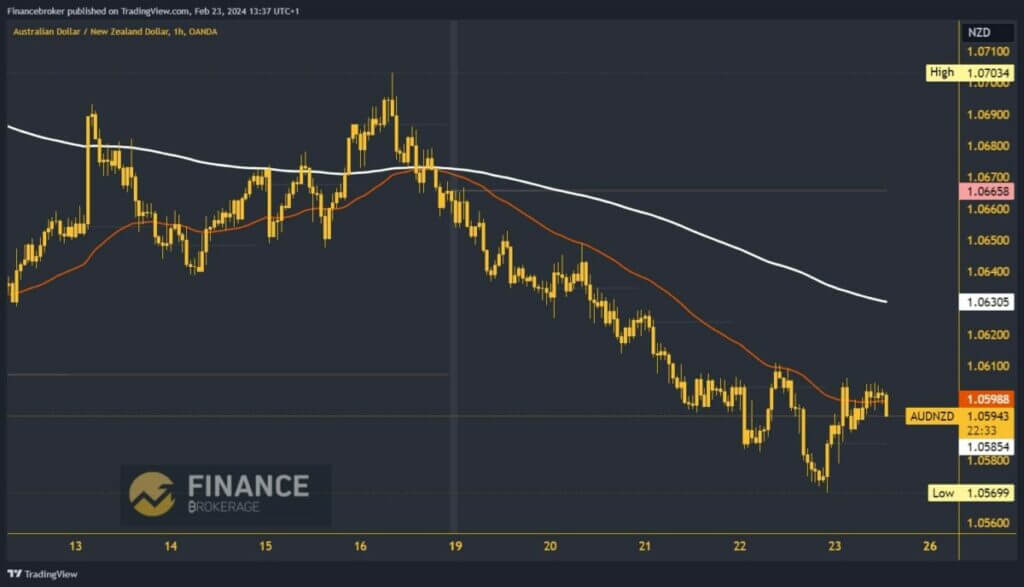
AUDNZD is in a bearish trend after climbing to 1.07034 levels last Friday. The pair was in retreat from Monday until last night, forming a weekly low at the 1.05699 level. During the Asian trading session, we saw a retracement and a rise to the 1.06060 level. We stop at that level, and so far, we have not managed to break above it. The pair is currently under pressure and has retreated to the 1.05950 level.
If a pullback is called for, the potential lower targets are 1.05900 and 1.05800. We need a break above the 1.06060 resistance level for a bullish option. Then, we should hold up there so that we can start the recovery with the next impulse. Potential higher targets are 1.06200 and 1.06300 levels. The EMA200 moving average at the 1.06300 level is additional resistance to the bullish continuation.


