AUD/USD forecast for January 11
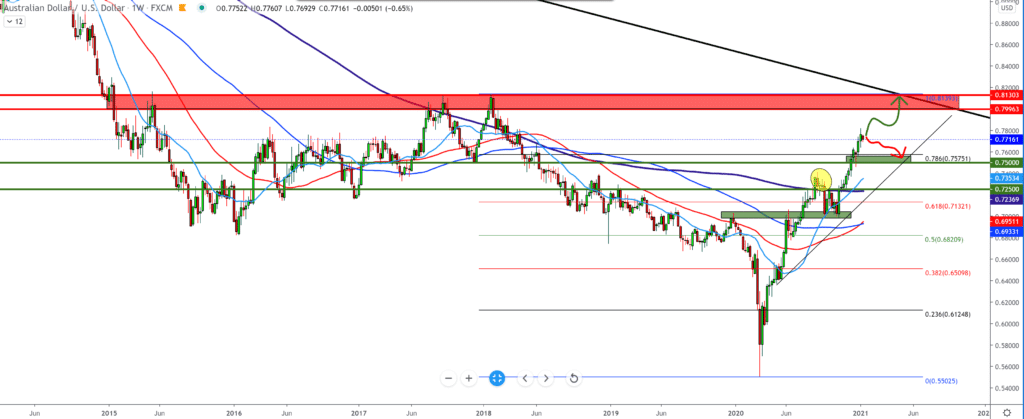
Looking at the chart on the weekly time frame, we see that the AUD started the week badly against the dollar and that if this week closes in red, we can expect the correction to continue to 0.75000. Today is Monday, and it’s still early for some safer sell signal. If we follow the Fibonacci level and expect a pullback as the target, we can have a Fibonacci level of 78.6% at 0.75700. Moving average indicators are far below and are currently on the support side for the Australian dollar. For the bullish scenario, we are looking above 0.78000 towards 0.80000 and the previous high from January 2018.

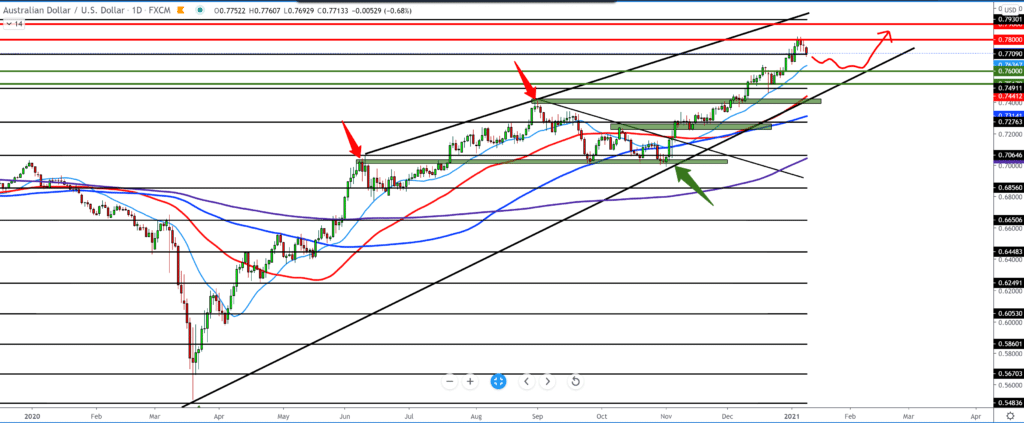
On the daily time frame, we see that the pair encounters resistance at 0.78000, and the pair starts to make a pullback to better support at around 0.76000 with support for the moving average MA20 (light blue line). Technically, the pair is moving in a growing channel. The trend is generally bullish; the pullback is only part of the cycle, making a consolidation waiting for a bigger chart movement.

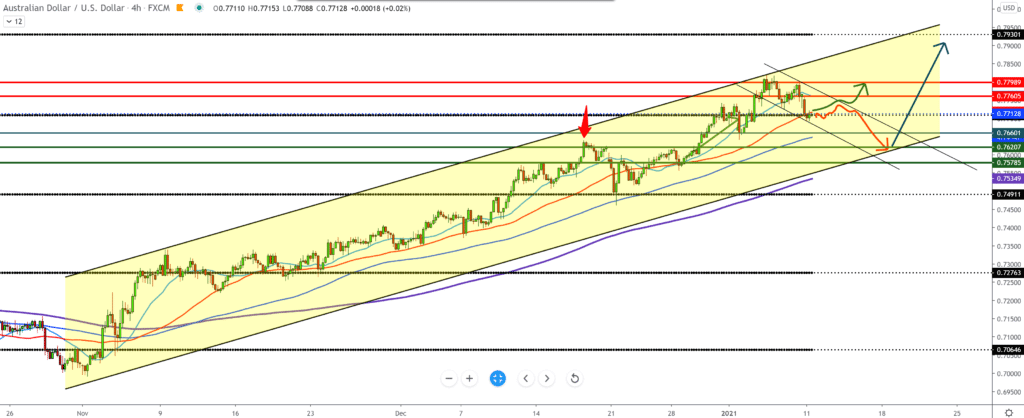
On the four-hour time frame, we see the movement of steam in the rising channel, where we have a break below the moving average of MA20 and MA50 and that there are probabilities of seeing a further pullback to 0.76000. Today, the bullish scenario can only watch up to MA20 to 0.77600 but as a pullback making a smaller drop channel as part of the chart correction.

The value of retail sales in Australia rose seasonally adjusted by 7.1 percent in the month of November. The Australian Bureau of Statistics announced on Monday, which amounted to 31.654 billion US dollars.
That exceeded expectations for growth of 7.0 percent after a 1.4 percent gain in October. On an annual basis, the value of sales increased by 13.3 percent.
-
Support
-
Platform
-
Spread
-
Trading Instrument


