


AUD/NZD analysis for April 20, 2021
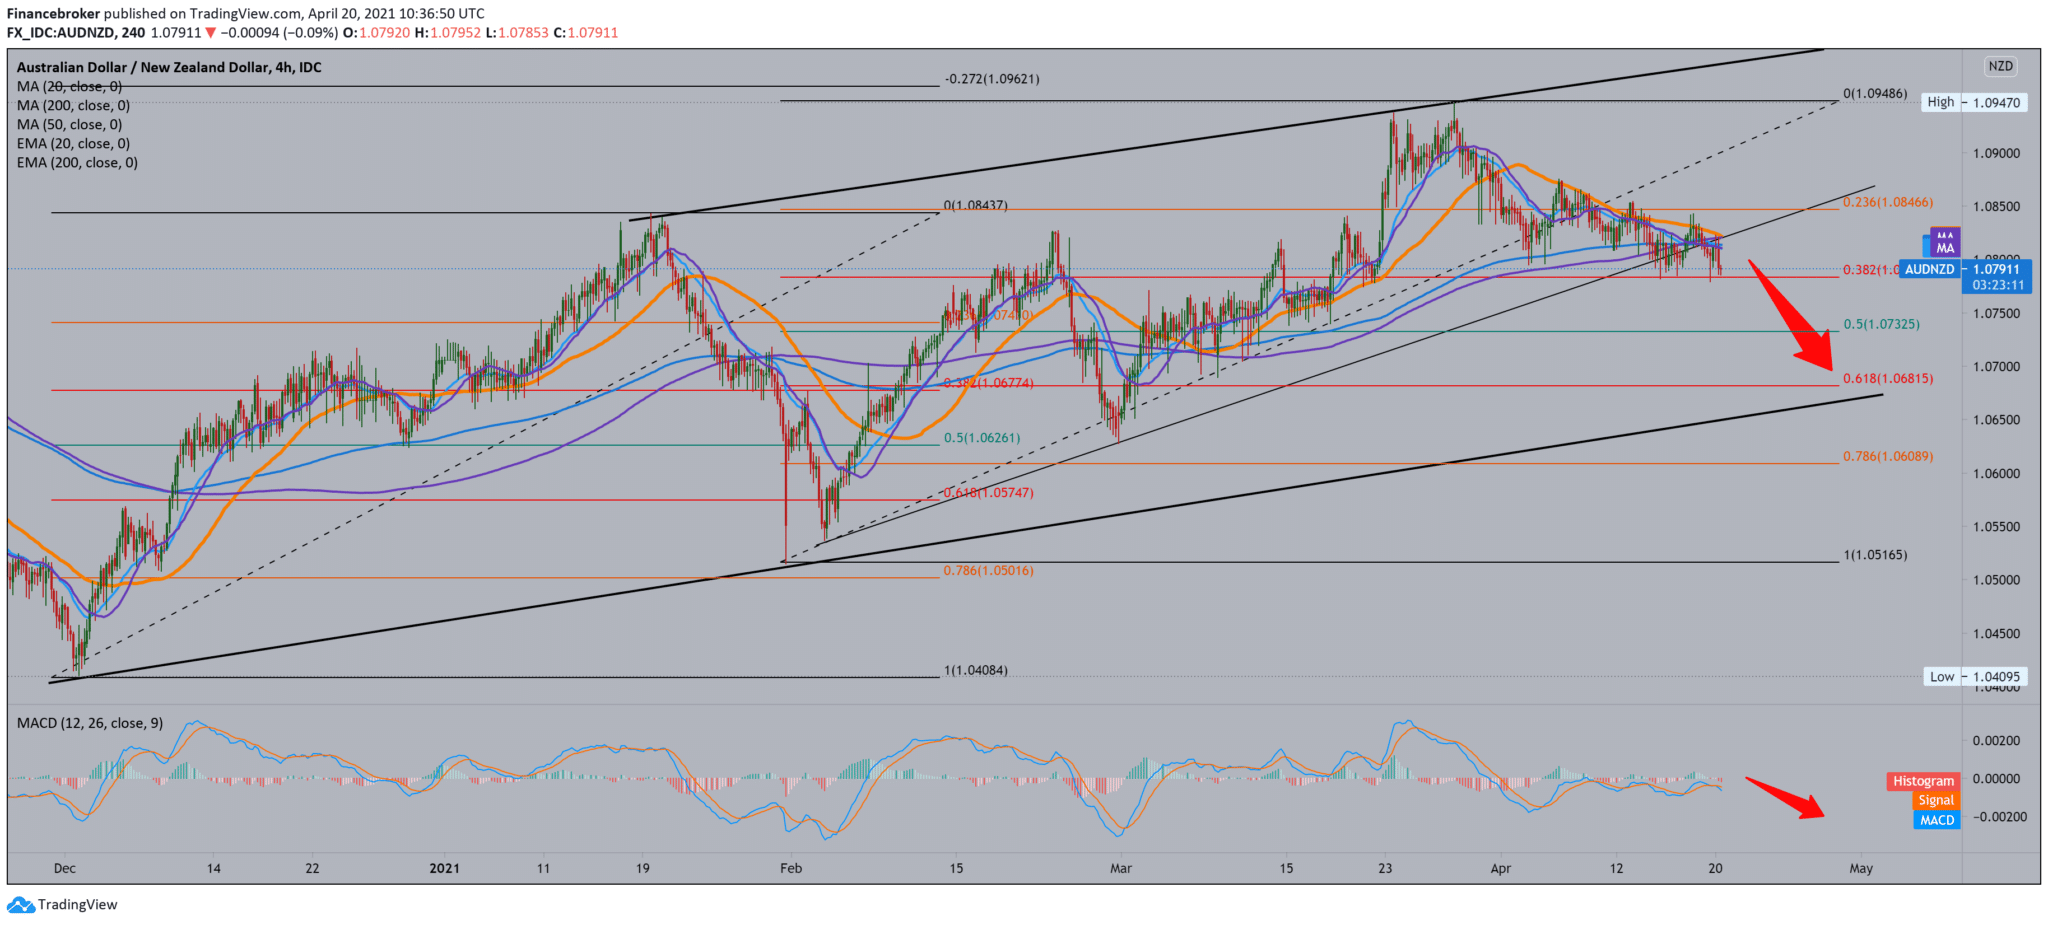
Looking at the graph on the four-hour time frame, we see that the AUD/NZD pair moves in one larger ascending channel, where after touching the upper edge of the channel, we see a pullback. For now, the AUD/NZD pair is under pressure from moving averages from the top, directing us in the continuation of the bearish trend. By setting the Fibonacci level, we see that the previous pullback to the bottom trend line was in the zone of 61.8-78.6% of the level.
We are currently testing 38.2% Fibonacci level at 1.07835; the break below leads us to a 50.0% level at 1.07325, and the maximum target in this channel at 61.8% level at 1.06810. The MACD indicator is on the bearish side, and the blue MACD line has crossed below the signal line, looking still deep on the bearish side.
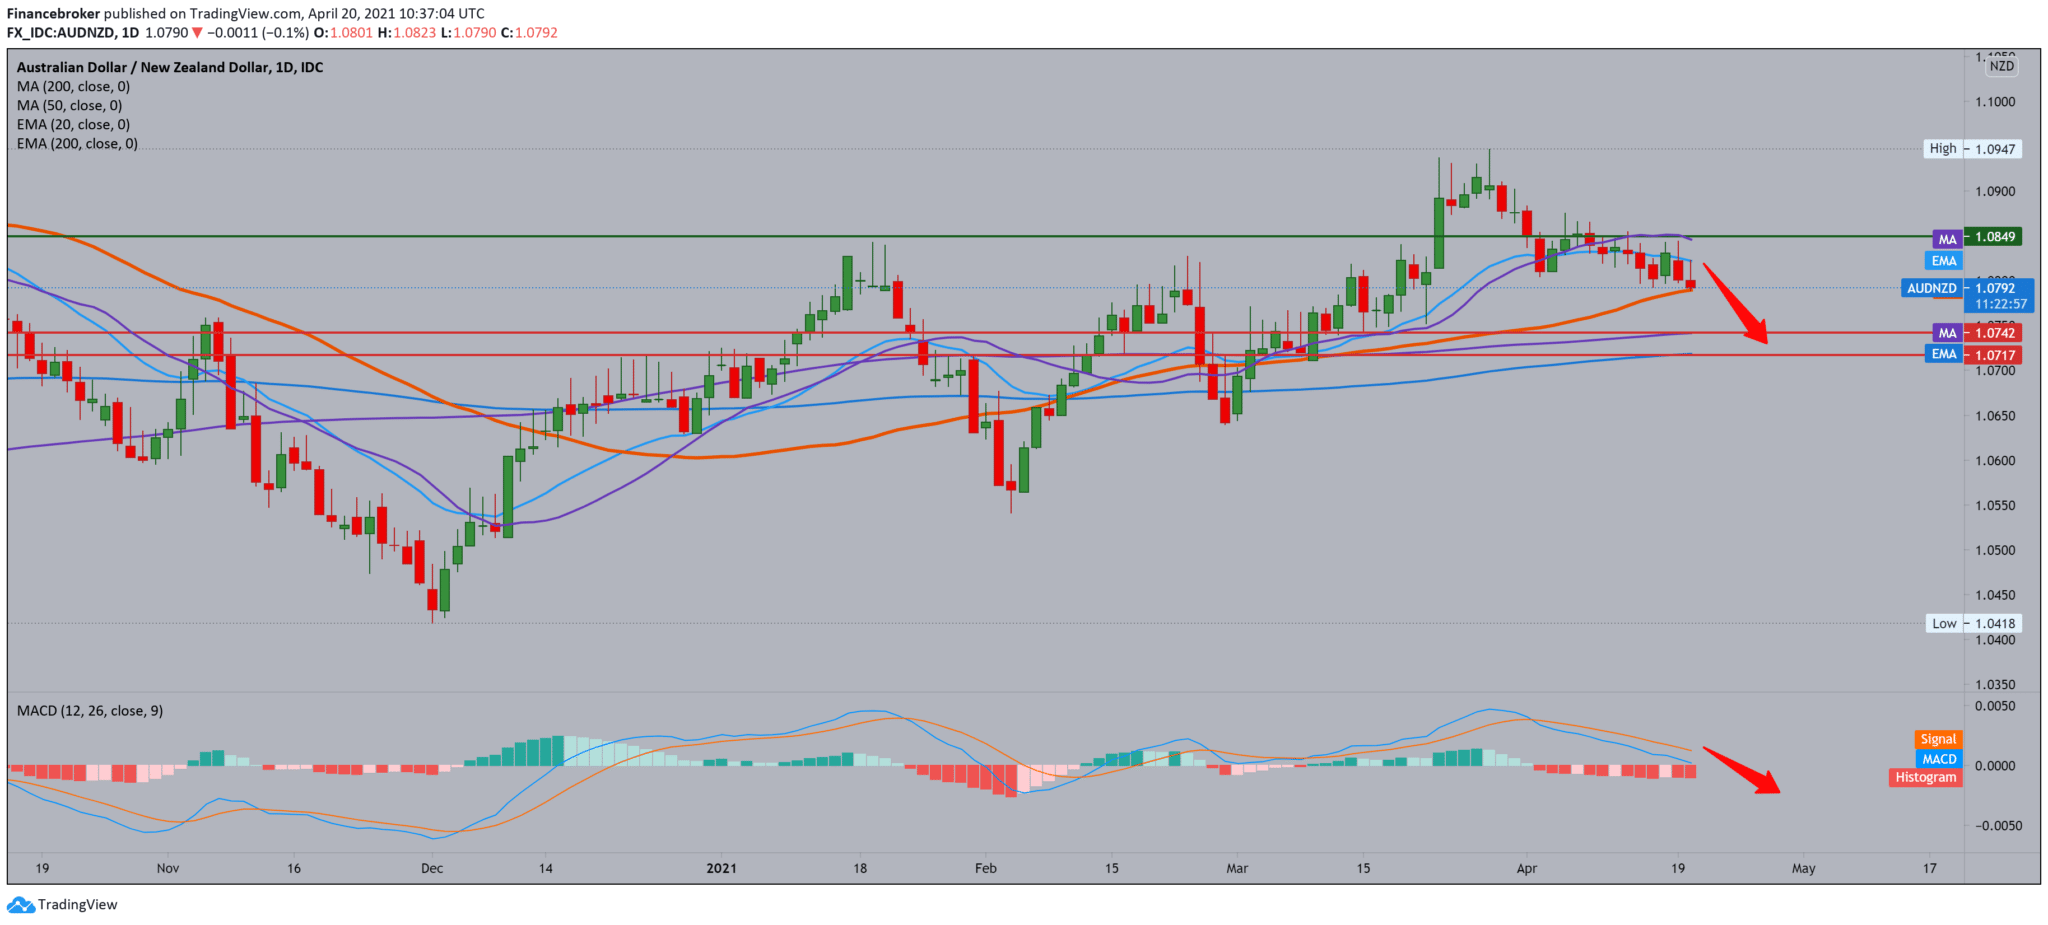
On the daily time frame, we see that after reaching the previous high, the AUD/NZD pair is in bearish consolidation, currently testing the moving average of MA50, but with the pressure of MA20 and EMA20 from the top. A stronger break below MA50 leads us to MA200 and EMA200 in zone 0.71500-0.74500. Looking at the MACD indicator, we have been in the bearish trend for the last couple of weeks, and for now, there are no signs that we will see a turnaround and ancestor in the bullish trend.
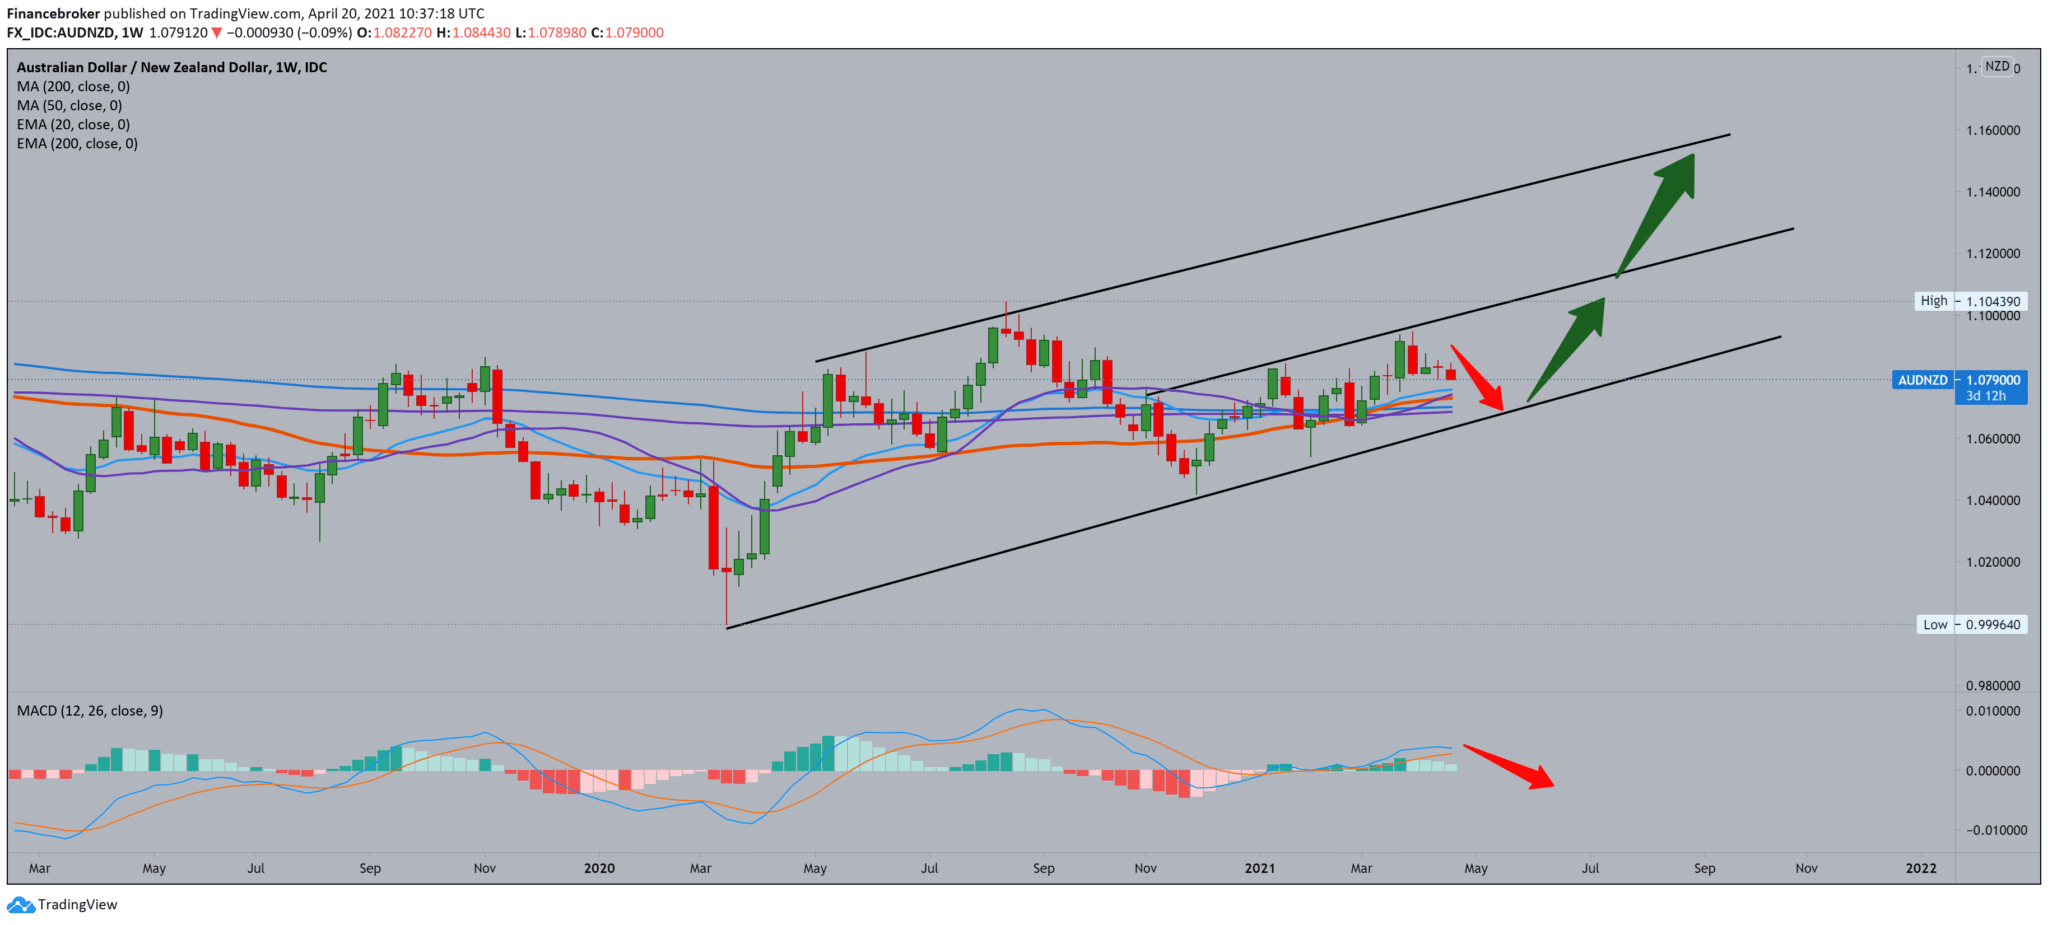
 On the weekly time frame, we see that we are in a big growing channel. The AUD/NZD pair is still moving close to the bottom line, but with the support of all moving averages. So we can expect an even smaller pull before the next sequel to the bullish side. The MACD indicator is making a turn, moving sideways, for now, making this now consolidation and lowering the AUD/NZD pair to lower levels on the chart.
-
Support
-
Platform
-
Spread
-
Trading Instrument

