


Ethereum analysis for April 20, 2021
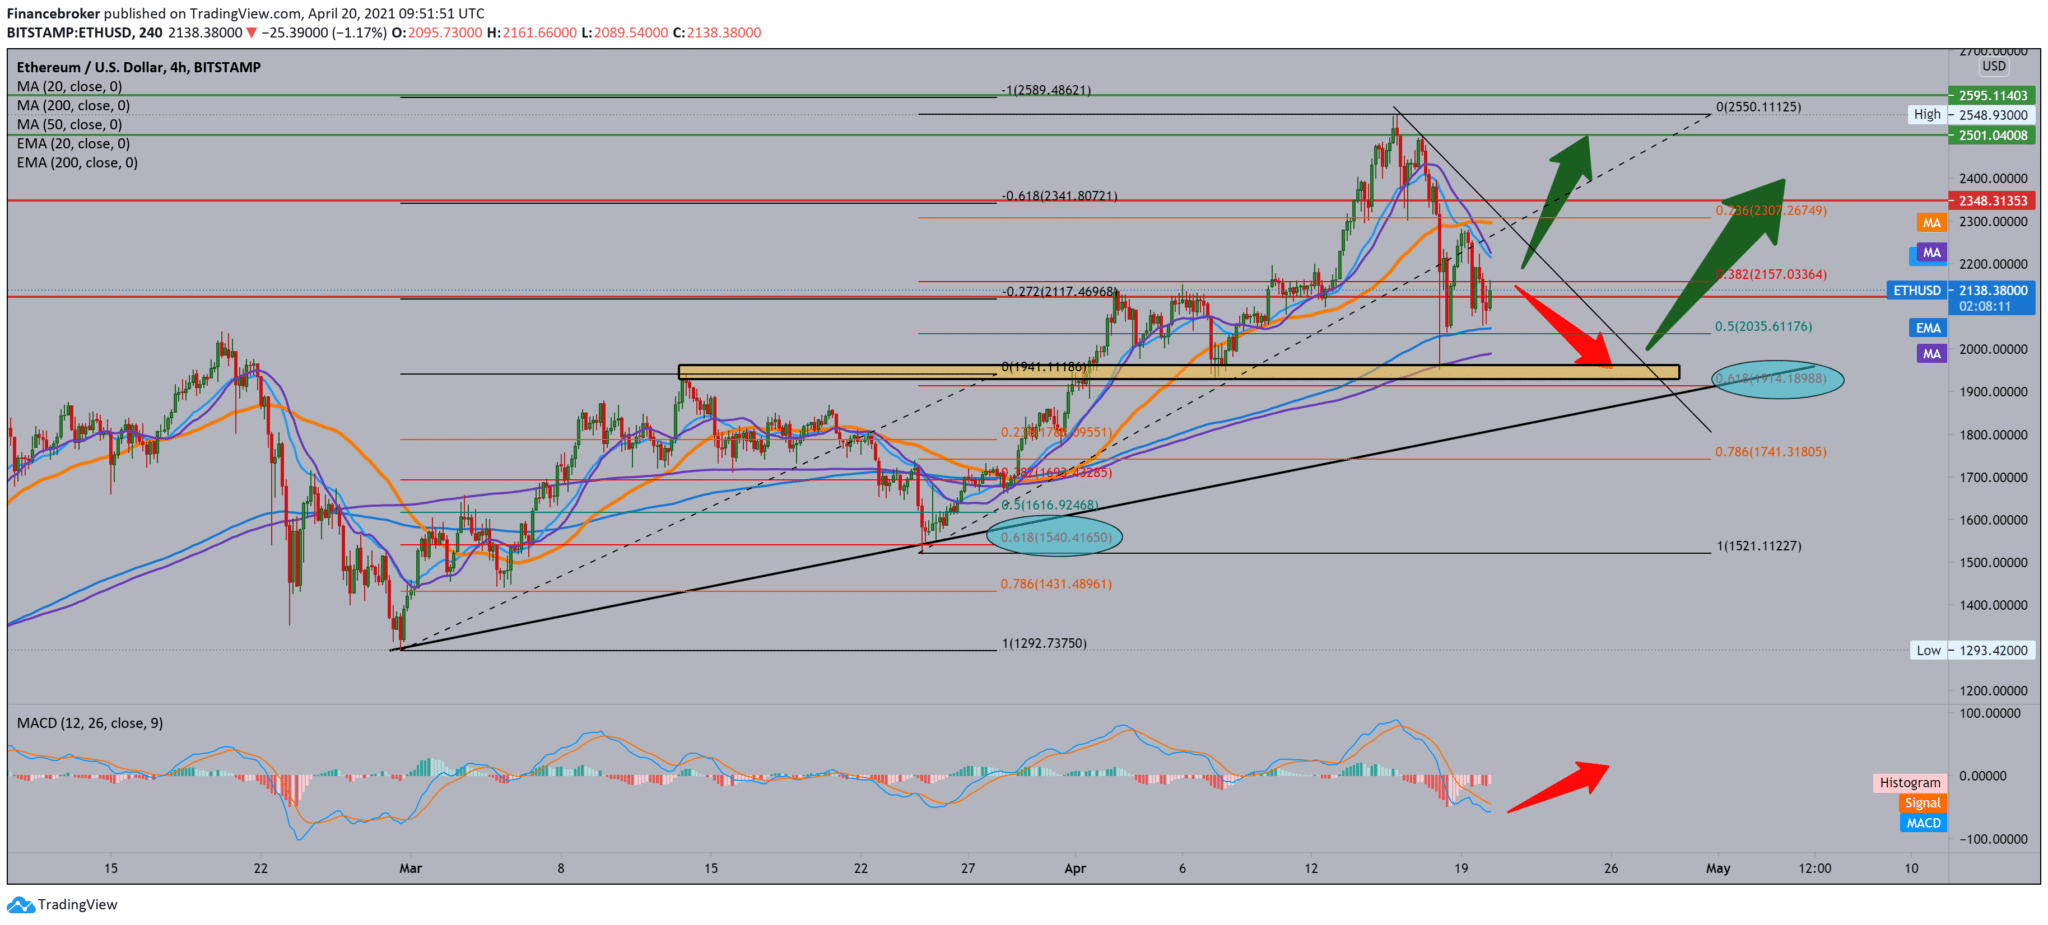
Looking at the chart on the four-hour time frame, we see that Ethereum finds current support on the moving averages of the MA200 and EMA200 around the $ 2000 price tag. After this support continues in the bullish trend, we need a break above MA20 and EMA20 with a break above $ 2150 at the Fibonacci 38.2% level. After that, we can look again at $ 2200, $ 2300 and even $ 2500.
For the bearish trend, we need a further pull below the moving averages of the MA200 and EMA200 and testing the lower trend line as the next stronger support. Following the MACD indicator, we see that there has been a slowdown in the bearish trend. Although we are still in it, we can expect some consolidation here where we are now.
Ethereum Intheblock data for entry/exit money around price (IOMAP) shows high resistance between $ 2,198 and $ 2,263, where 158.1 thousand addresses bought 8.71 million ETH. The price range includes 161.8% of Fibonacci’s bear market expansion for 2018 to $ 2,247.68. The second-largest cryptocurrency by market capitalization introduced a hard fork to solve a significant issue for the network – high gas charges. Gasoline fees have risen in the last 12 months, and users noticed in February this year that transaction costs jumped from below 10 cents to a high $ 40.
Currently, the average fee is close to 19 US dollars, but that is far more than the minimum fees that peers like Cardano and Algorand charge.
Network hard fork has changed the algorithm for calculating fuel charges to reduce costs that might otherwise take users to other platforms.
-
Support
-
Platform
-
Spread
-
Trading Instrument

