


What’s next for Gold and Silver
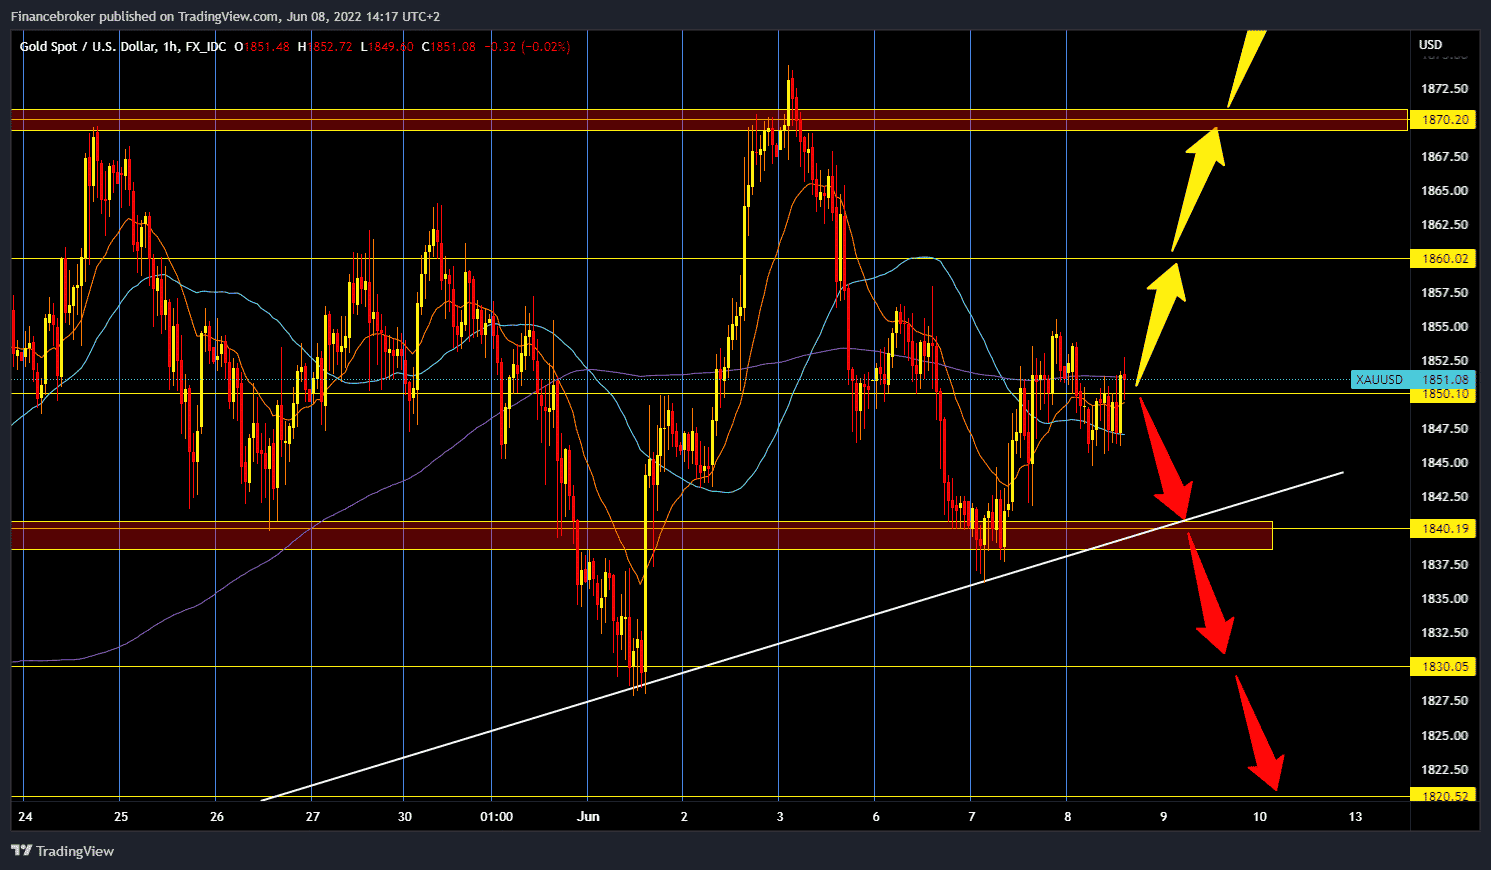
- During Asian trading, the price of gold continued to be around 1850 dollars on a consolidated basis.
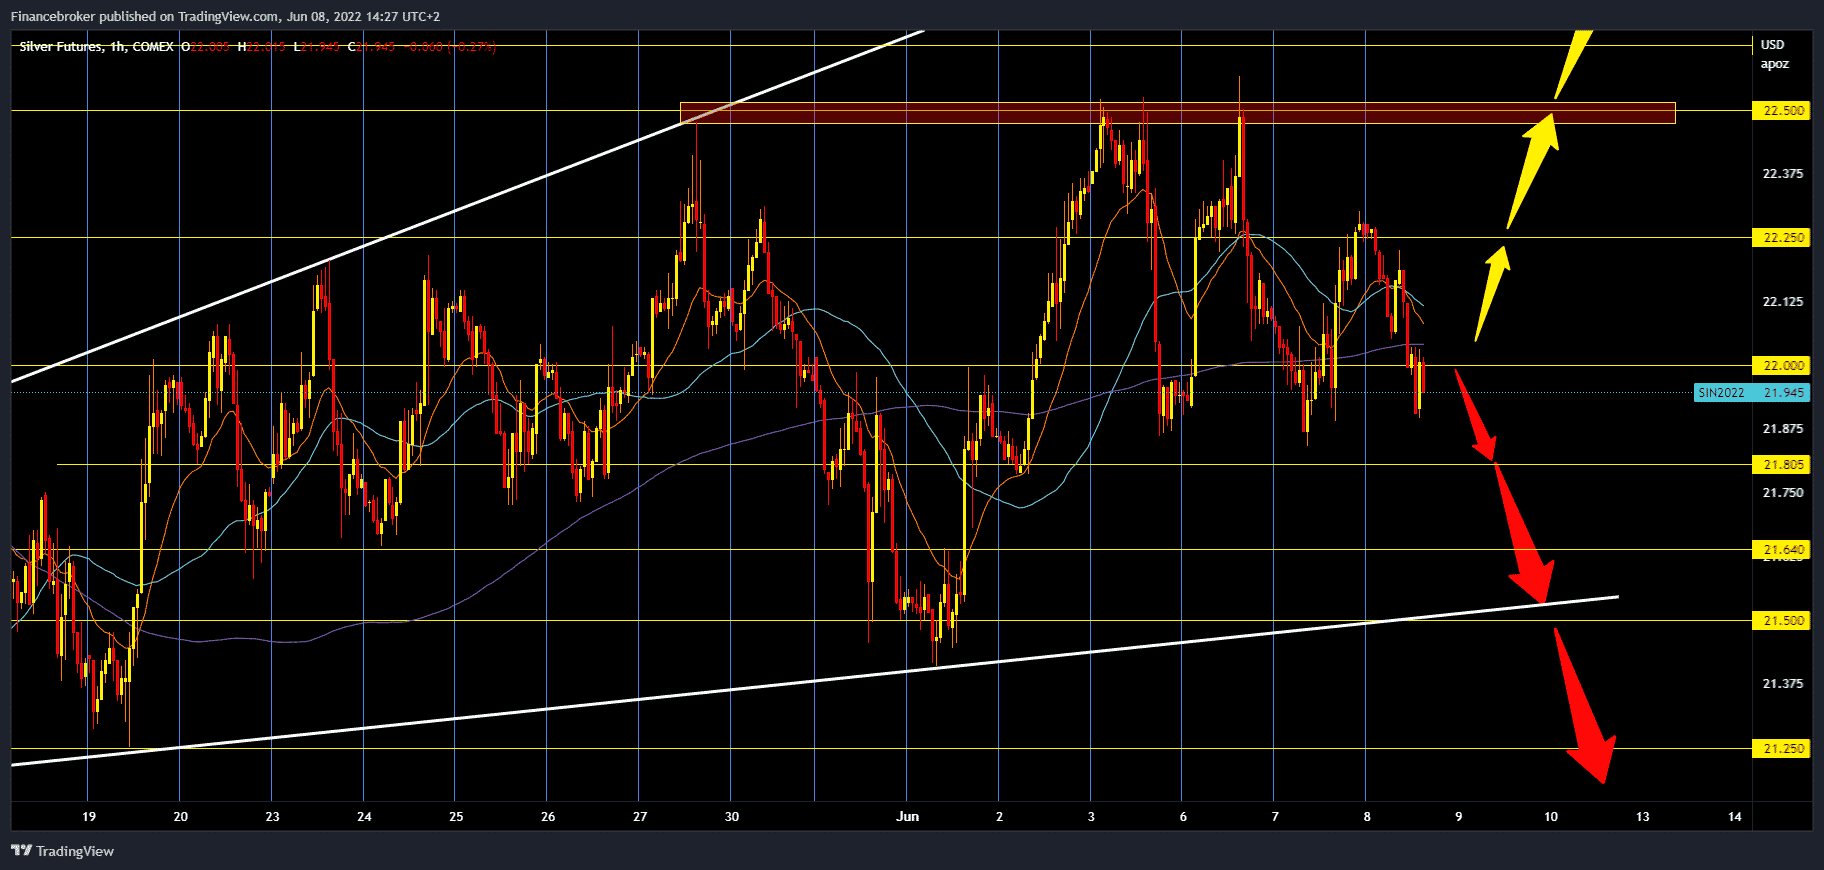
- The price of silver continues its side consolidation between $ 22.00 and 22.50.
- Gold, inflation, and the World Bank GDP
Gold chart analysis
During Asian trading, the price of gold continued to be around 1850 dollars on a consolidated basis. The increase in yields on U.S. government bonds pushed the price of gold down. The ten-year bond again yields more than 3% in competition for holding gold. The price of gold is trading around 1850.95 dollars per fine ounce, which is a drop of 0.06% since the beginning of trading last night. The latest and very important news about price inflation in the USA is expected on Friday. For the bullish option, we need continued positive consolidation and a break above yesterday’s high at $ 1,855. The potential bullish target is first $ 1,860, then last week’s high at $ 1,870. For the bearish option, we need negative consolidation and a pullback below $ 1845. After that, we can expect the withdrawal to the $ 1840 support zone to continue. Additional support is in our bottom trend line. A break below this line would increase bearish pressure, which would lead to a further continuation of the pullback price of gold.
Silver chart analysis
The price of silver continues its side consolidation between $ 22.00 and 22.50. Silver has already tested support at $ 22.00 three times, and what is important for us is that the price formed a lower high yesterday at $ 22.25. These are all signs of a potential bearish trend and lowering the price. For the bearish option, we need a drop below $ 22.00. After that, we look at where we can look for potential support on the chart. Our first potential support is the $ 21.80 level. The price break below lowers us further towards the $ 21.50-21.60 support zone on the bottom trend line. For the bullish position, we need positive consolidation and a return above $ 22.25. If the price of silver manages to do that, our next bullish target is the $ 22.50 June resistance zone.
Market overview
Gold, inflation, and the World Bank GDP
The price of gold cancels out part of the previous recovery, in light of the significant demand for US dollars, along with the recovery of yields on the treasury. Thanks to fears of a global recession, the dollar is capitalizing on risk reduction flows while central banks are tightening monetary policy to fight inflation. On the other hand, rising inflation expectations increase the yields on the chart, adding to the weight of the gold chart. Yet bulls on gold are managing to find some support in the bleak outlook for the global economy, following GDP cuts by the World Bank and the OECD. Traders are still focused on the data on inflation in the United States, which awaits us on Friday.

