USDCHF near 0.8750 and USDJPY is recovering from yesterday
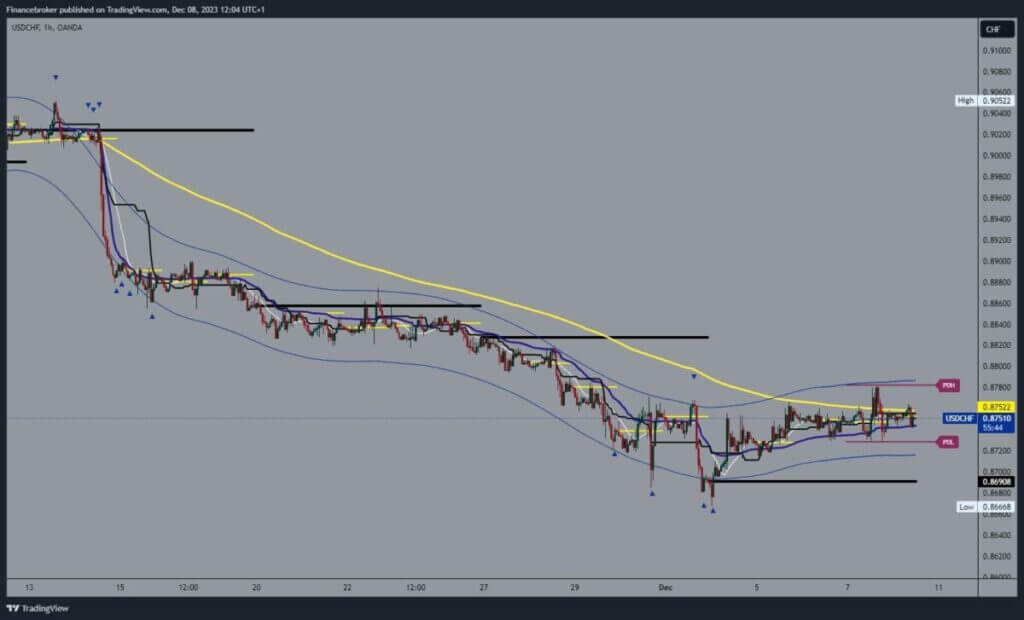
- This week was marked by a recovery in the USDCHF.
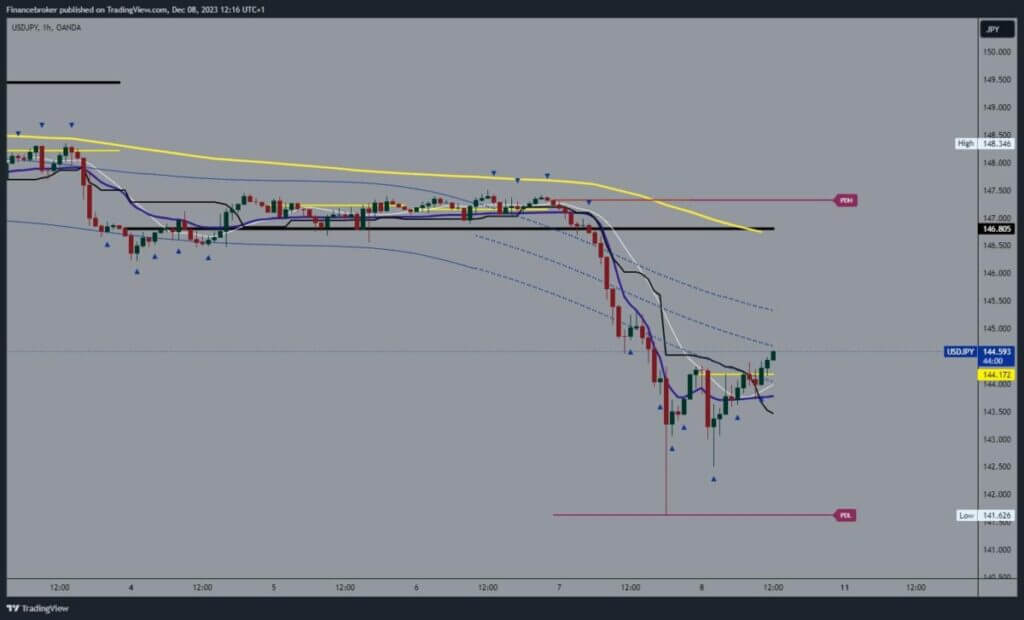
- Yesterday, we saw a big USDJPY pullback from 147.50 to 141.62 levels.
USDCHF chart analysis
This week was marked by a recovery in the USDCHF. On Monday, we started with 0.86668. Yesterday, we formed this week’s high at the 0.87800 level. On the positive side, we are slowly moving above the EMA50 moving average and may get support from it soon. We are currently hovering around the 0.87500 level when testing the EMA50. It would be positive if we moved to the 0.87800 resistance level again.
There, we would have the opportunity to move above and initiate further recovery. Potential higher targets are 0.88000 and 0.88200 levels. We need a negative consolidation and pullback below the 0.87200 level for a bearish option. This would lead to forming a new low and confirm the bearish momentum. Potential lower targets are 0.87000 and 0.86800 levels.

USDJPY chart analysis
Yesterday, we saw a big USDJPY pullback from 147.50 to 141.62 levels. During the Asian trading session, the pair decreased from 144.20 to 142.50. This was followed by a bullish consolidation that took us up to 144.50 levels. If this trend continues, we could soon find ourselves above 145.00. With that, we would form a new daily high and establish a bullish option. Potential higher targets are 145.50 and 146.00 levels.
We need a negative consolidation and pullback below the 143.50 level for a bearish option. Thus, we would start a decline and be turned towards the support zone around 143.00. After that, we expect to see a further decline to lower levels. Potential lower targets are 142.50 and 142.00 levels.


