USDCAD: Back in the Zone Around 1.36000 Today
- USDCAD is recovering from Friday’s drop from 1.36000 to 1.35450 level.
- USDCNH managed to form a new weekly high at the 7.21380 level in this hour.
USDCAD chart analysis
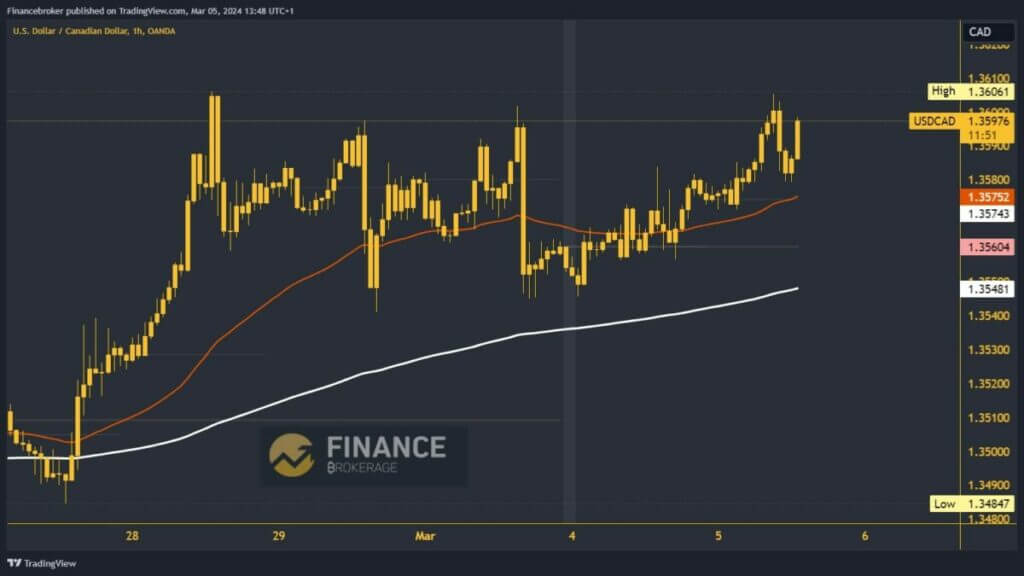
USDCAD is recovering from Friday’s drop from 1.36000 to 1.35450 level. This morning, we formed a new weekly high at the 1.36061 level. We stop there for now and pull back to support at 1.35800 levels. With new support at that level, the pair is again within reach of the 1.36000 level. If this consolidation continues, we can expect a break above and the formation of a new weekly high. Potential higher targets are 1.36100 and 1.36200 levels.
For a bearish option, we need a negative consolidation and pullback below the support at the 1.35800 level. After that move, USDCAD would test the Asian low. New pressure could easily push the pair below, thus forming a daily low and confirming the bearish momentum. Potential lower targets are the 1.35600 and 1.35500 levels. The EMA200 moving average provides additional support in the zone around 1.35500 levels.

USDCNH chart analysis
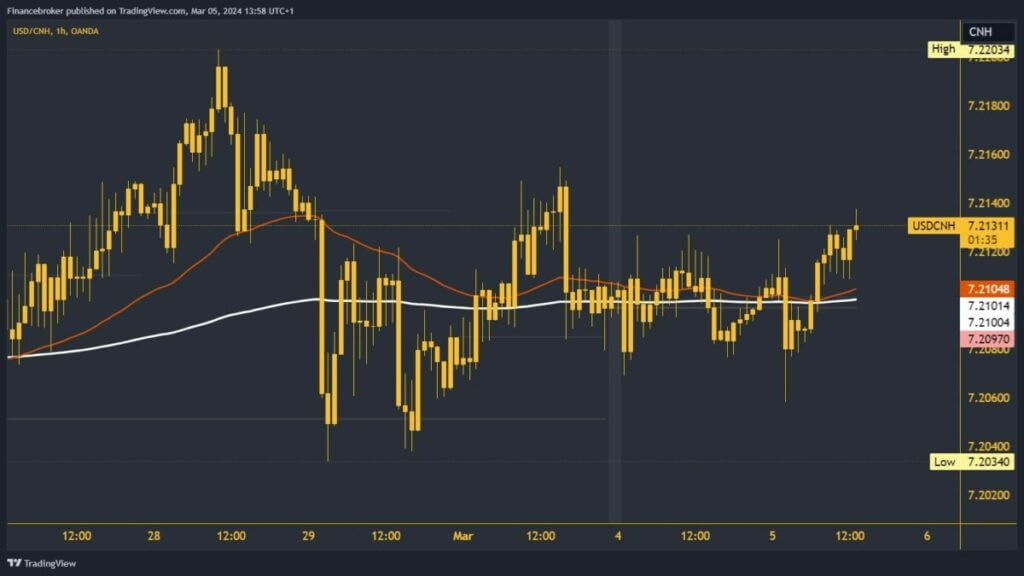
USDCNH managed to form a new weekly high at the 7.21380 level in this hour. From the market’s opening on Sunday until the start of today’s EU session, this pair’s movement was sideways without more concrete indications of a specific bullish or bearish trend. The current situation is different, as we are looking at a bullish consolidation and a breakout above the upper limit of the lateral consolidation.
Potential higher targets are 7.21400 and 7.21600 levels. For a bearish option and a pullback of USDCNH, we need a drop below 7.21000 and the EMA200 moving average. In the zone around 7.20800, we would be under pressure to slide to a new daily and weekly low. Potential lower targets are 7.20600 and 7.02500 levels.


