USDCAD and USDCNH: USDCAD slides below 1.3500 under pressure
- Since the start of the week, USDCAD has been in retreat.
- This week’s movement of USDCNH takes place in the 7.24000-7.21300 range.
USDCAD chart analysis
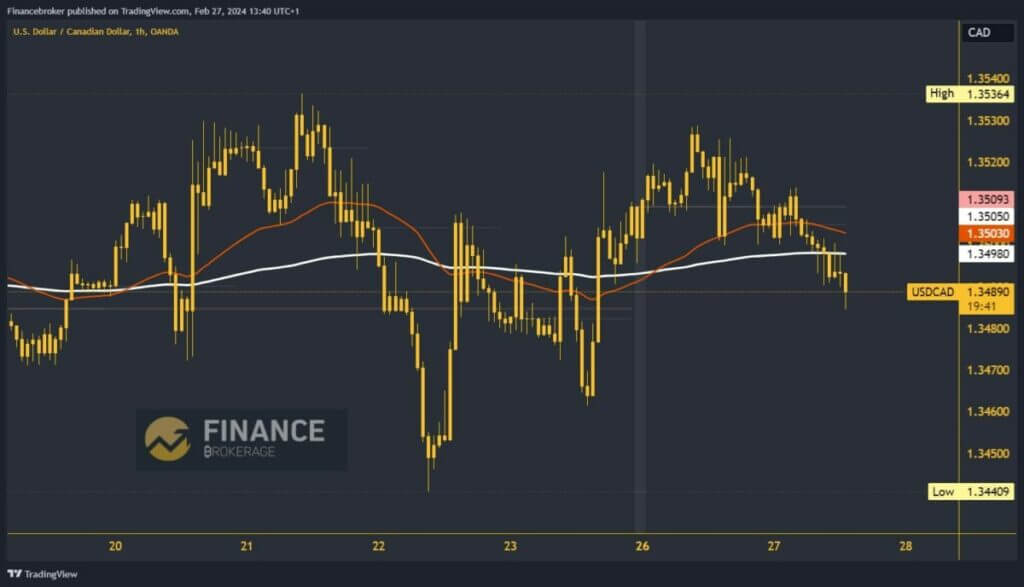
Since the start of the week, USDCAD has been in retreat. We spent Monday trying to hold above the 1.35000 level. During the Asian trading session, the dollar weakens again, and the pair falls below 1.35000 and the EMA200 moving average. Today’s low is at 1.34750 levels, but since it is still very low, it is possible that we will see the formation of a new weekly low. Potential lower targets are 1.34800 and 1.34700 levels.
USDCAD must return above the EMA200 and 1.35000 levels for a bullish option. Then we have to hold up there and make that new bottom. With a new impulse, we would start a bullish consolidation. Moving above the 1.35100 level, we climb above the weekly open price, strengthening optimism for further recovery. Potential higher targets are 1.35200 and 1.35300 levels.

USDCNH chart analysis
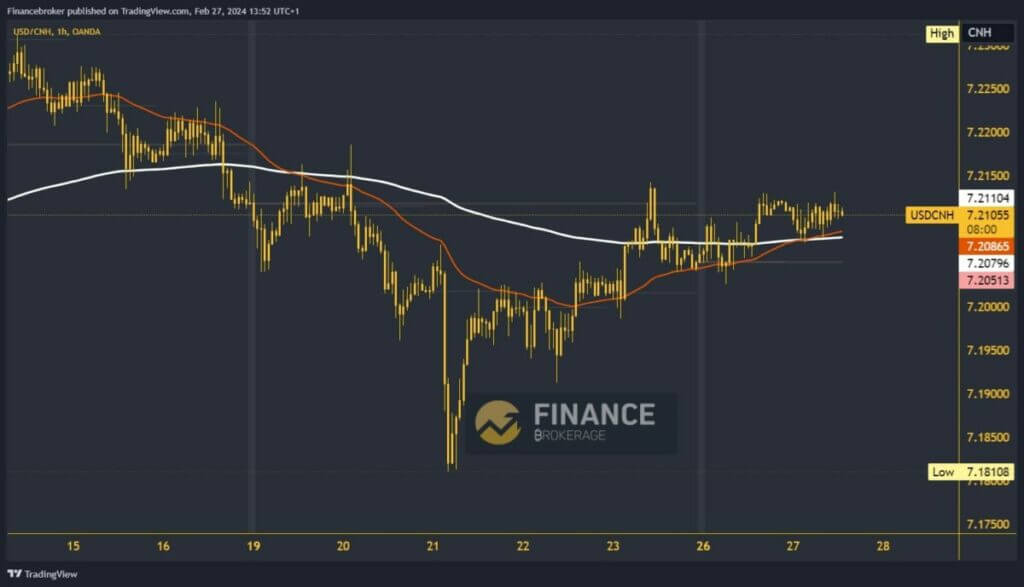
This week’s movement of USDCNH takes place in the 7.24000-7.21300 range. The movement is quite calm but on the positive side, above the EMA200 moving average. There are mild indications that we will see a continuation of the dollar’s recovery against the Chinese yuan. A break above 7.21500 would strengthen the bullish option, and we could expect further growth to higher levels. Potentially higher targets are 7.22000 and 7.22500 levels.
We need a negative consolidation and pullback below the EMA200 and 7.20500 levels for a bearish option. There, we would test the weekly open price. Falling below increases the bearish pressure on the dollar, and the currency could fall to a new weekly low. That would confirm bearish momentum and potential lower targets are 7.20000 and 7.19500 levels.


