Unraveling the Euro Index: Resistance at 1036.7 Today
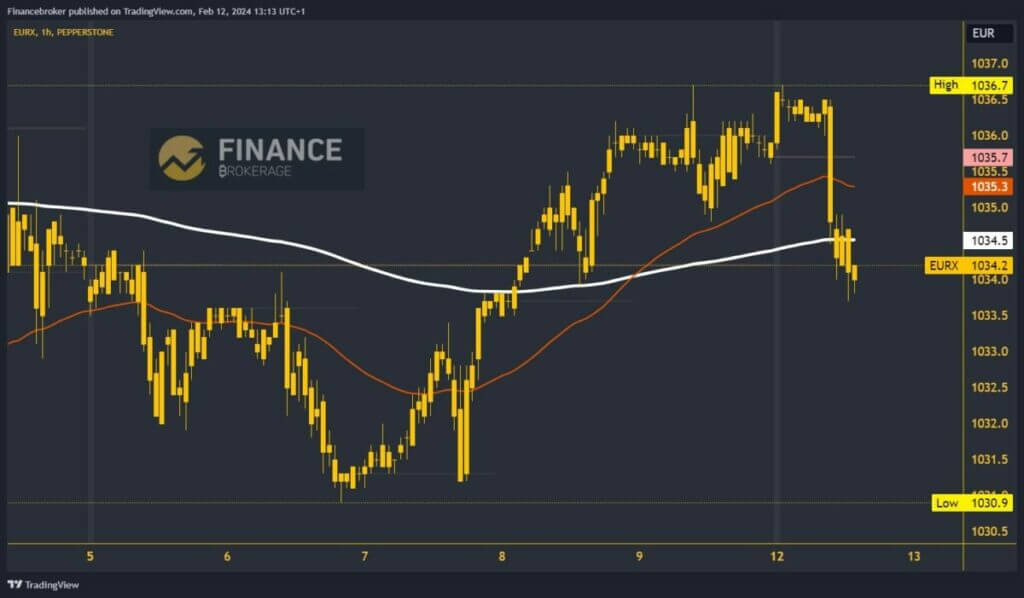
- During the Asian trading session, the Euro index encounters resistance at the 1036.7 level.
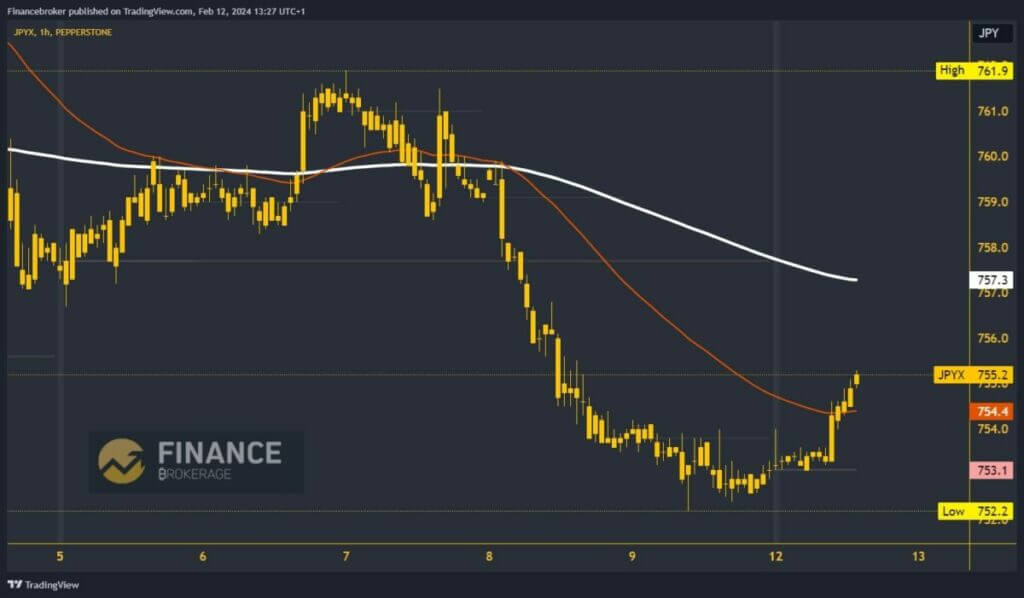
- On Friday, the yen index fell to the 752.2 support level.
Euro index chart analysis
During the Asian trading session, the Euro index encounters resistance at the 1036.7 level. After the consolidation above 1036.0 levels, a strong bearish impulse occurred at the start of the EU session, which brought us down to 1033.8 levels. Additional pressure is exerted by the EMA200, which is now on the bearish side. This could influence us to see a deeper pullback in the euro index. Potential low targets are 1033.0 and 1032.0 levels.
If the index consolidates and stops this pullback, it could start a recovery and move back above the 1035.0 level. It would again receive support from the EMA200 moving average, improving the euro’s picture for growth to previous higher levels. Potential higher targets are 1036.0 and 1037.0 levels. Moving the euro index above 1037.00 means we would get out of the previous two-week support zone.

Yen index chart analysis
On Friday, the yen index fell to the 752.2 support level. After the check, we managed to get support and start a recovery during the previous Asian trading session. The positive consolidation took us up to the 755.2 level, and we expect to see continued growth by the end of the day while we are still in the surge. Potential higher targets are 756.0 and 757.0 levels.
We will have additional pressure in the EMA200 moving average in the zone of 757.0 levels. We need a negative consolidation and pullback below the 754.0 level for a bearish option. Thus, we would form a lower high and again face this morning’s support zone. Potential lower targets are 753.0 and 752.0 levels.


