The price of Oil jumped, new high for Natural gas at $1,82
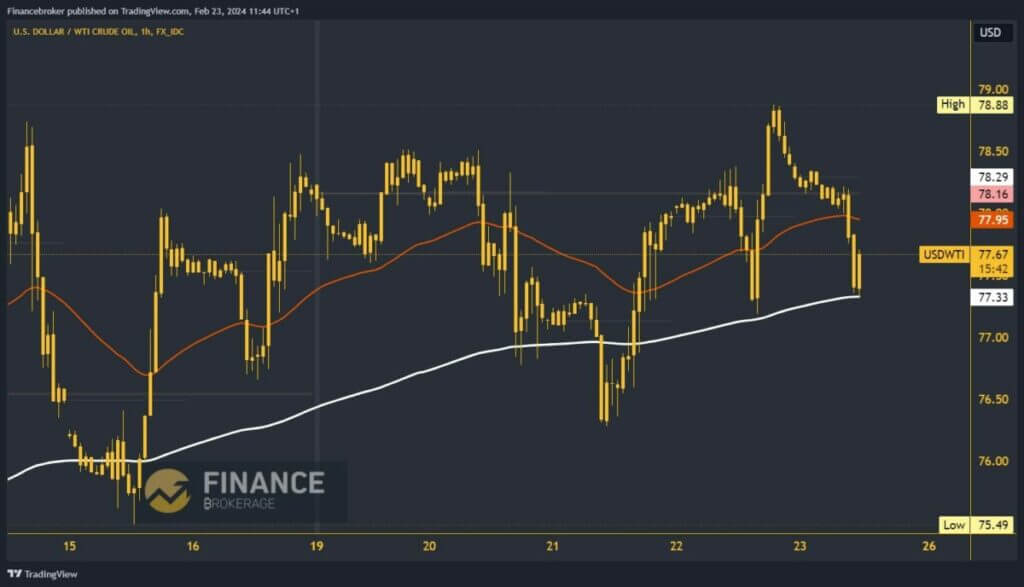
- Yesterday, we saw a jump in the price of oil to its weekly high at the $78.88 level.
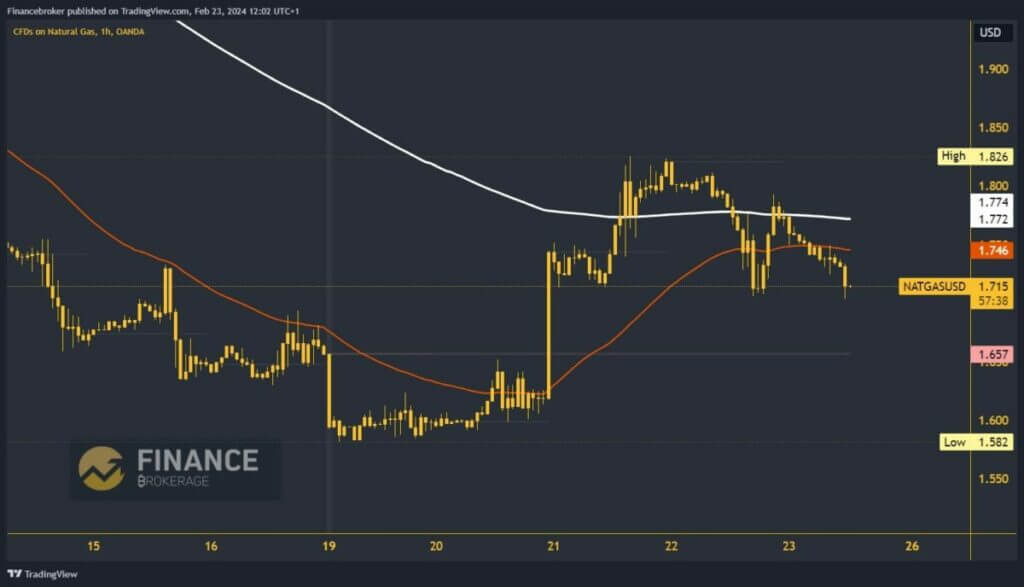
- At the beginning of this week, the price of natural gas reached a new annual low of $1.58.
Oil chart analysis
Yesterday, we saw a jump in the price of oil to its weekly high at the $78.88 level. The price initiates a pullback from that level and falls below the $78.50 level. During the Asian trading session, oil continued to slide below $78.00, so we can now see the formation of a daily low at the $77.35 level. We encounter the EMA200 moving average in that zone and expect its support as in previous cases.
If there is a breakthrough below the oil price, it would form a new day low and strengthen the bearish option. Potential lower targets are $77.00 and $76.50 levels. For a bullish option, we need a return above the $78.00 level and maintenance there. We would have to wait for a new impulse to continue to the bullish side. Potential higher targets are $78.50 and $79.00 levels.

Natural gas chart analysis
At the beginning of this week, the price of natural gas reached a new annual low of $1.58. We saw a sideways consolidation in the $1.58-$1.65 range on Monday and Tuesday. On Tuesday, the higher price makes a strong bullish impulse and moves to the $1.75 level. We made another bullish step to the $1.82 level on Wednesday, forming a weekly high. This was followed by a pullback from that level below the $1.80 level to support at the $1.70 level.
If price pressure continues, we could see a further pullback, and potential lower targets are $1.67 and $1.65. We need a return above the $1.80 level and the EMA200 moving average for a bullish option. Then, the gas price would have to stay up there if it plans to start a further recovery. Potential higher targets are $1.85 and $1.85 levels.


