The price of Gold continues to rise, silver is also going up
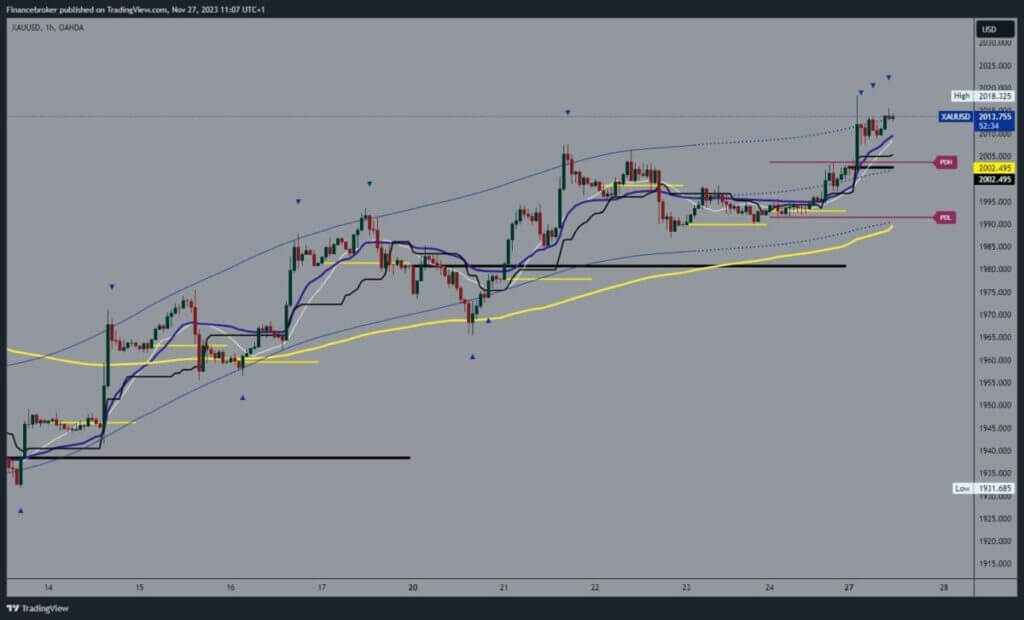
- During the Asian trading session, we saw a new jump in the price of gold to the $2018 level.
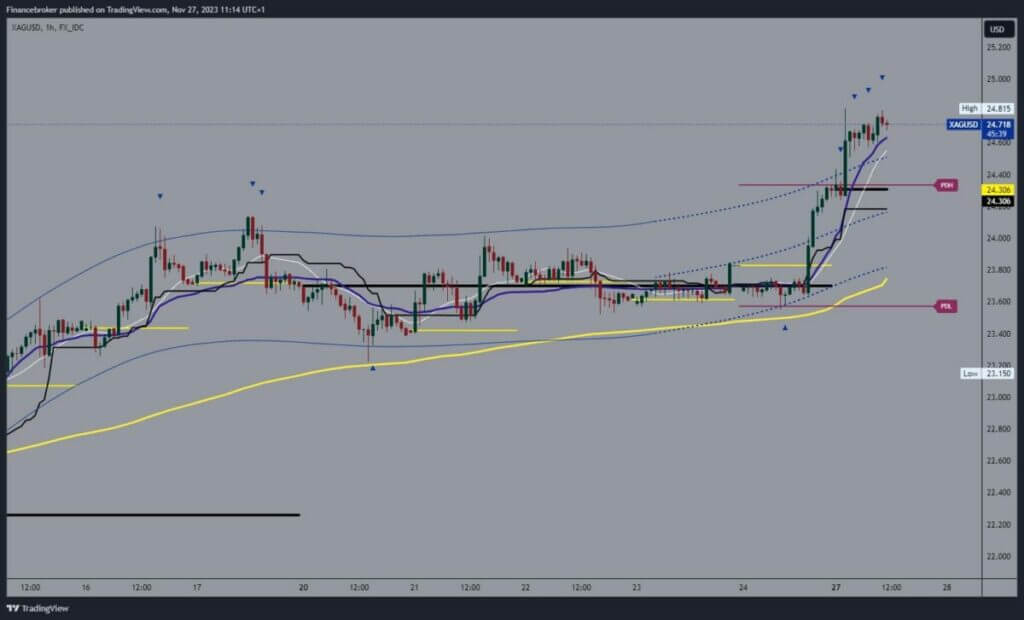
- During the Asian trading session, we saw a continuation of the bullish consolidation from Friday all the way to the $24.81 level.
Gold chart analysis
During the Asian trading session, we saw a new jump in the price of gold to the $2018 level. At that level, we formed a new six-month gold price high. After that, we see a slight pullback to the $2010 levels, where we manage to get support and initiate a new bullish consolidation. We are now already at 2015$, and we could soon test the previous high prices. Potential higher targets are $2020 and $2025 levels.
We need a negative consolidation and a new pullback below the $2010 level for a bearish option. In this way, we could initiate a bearish impulse and see the formation of a new low gold price. Potential lower targets are $2005 and $2000 levels. EMA50 moving average is in the zone around $1995 levels.

Silver chart analysis
During the Asian trading session, we saw a continuation of the bullish consolidation from Friday all the way to the $24.81 level. After that, the price starts consolidating in the $24.60-$24.80 range. We continue to hold high and expect to see a breakout above the previous high and form a new one. Potential higher targets are $25.00 and $25.20 levels. The last time we were above $25.00 was in July.
We need a negative consolidation and pullback to the previous low at the $24.40 level for a bearish option. Next, we need a breakout below that would lead to the formation of this week’s new low. Potential lower targets are $24.20 and $24.00 levels. The EMA50 moving average is in the zone around $23.80 levels.


