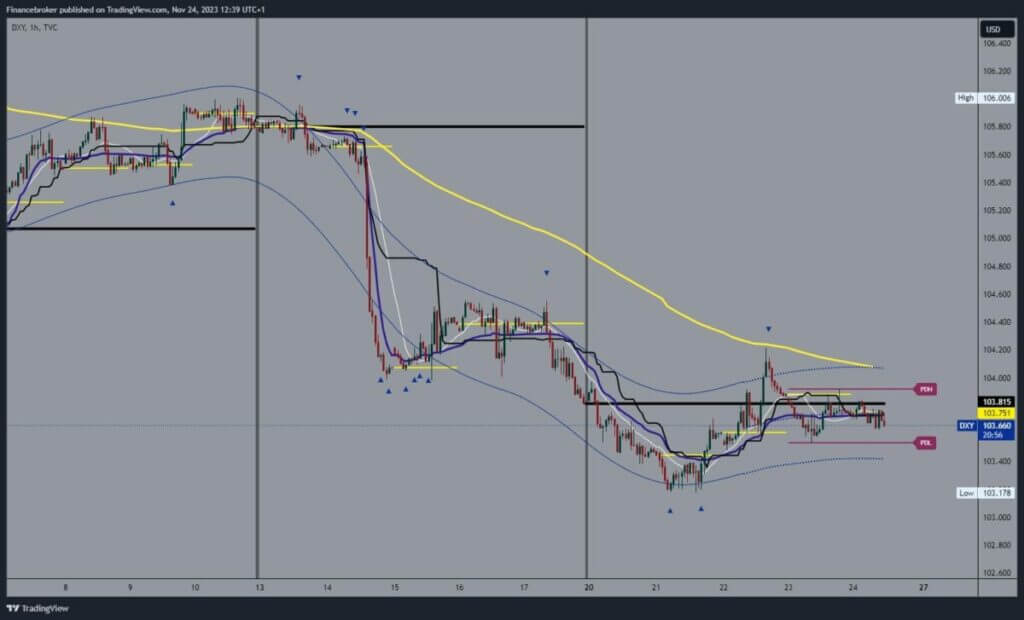
The dollar index remains in the support zone at 103,50
- This week, we saw the dollar index pull back to 103.17, forming a new low there.
Dollar index chart analysis
This week, we saw the dollar index pull back to 103.17, forming a new low there. That happened on Tuesday, after which we managed to stop the decline and get support in that zone. The dollar starts a bullish consolidation and jumps to the 104.20 level. We literally just touched the EMA50 moving average and started a new pullback.
That bearish consolidation took us down to the 103.50 level, where we are getting new support. Below, we see a lateral consolidation in the 103.50-103.80 range. The negative for the dollar is that it could close below the market opening price on Monday, and the positive is that the drop is minimal compared to last Friday’s closing price.

103.20 is bullish support, and 104.00 is bearish resistance
We need a positive consolidation and a move to the 104.00 level for a bullish option. There, we would be under more pressure because we came across the EMA50 moving average, which in the previous attempt managed to resist and send us down. With a break above it, it would be much easier for the dollar to start further growth on the bullish side. Potential higher targets are 104.20 and 104.40 levels.
Next week, we will have more economic news from all three markets. Monday is in charge of Building Permits and New Home Sales; on Wednesday, we have the RBNZ and the interest rate statement, German CPI and US GDP; on Thursday, China’s Manufacturing PMI index, Eurozone CPI, and US Core PCE Price Index. To finish on Friday, we have the US ISM Manufacturing PMI and report from Fed Chair Powell.


