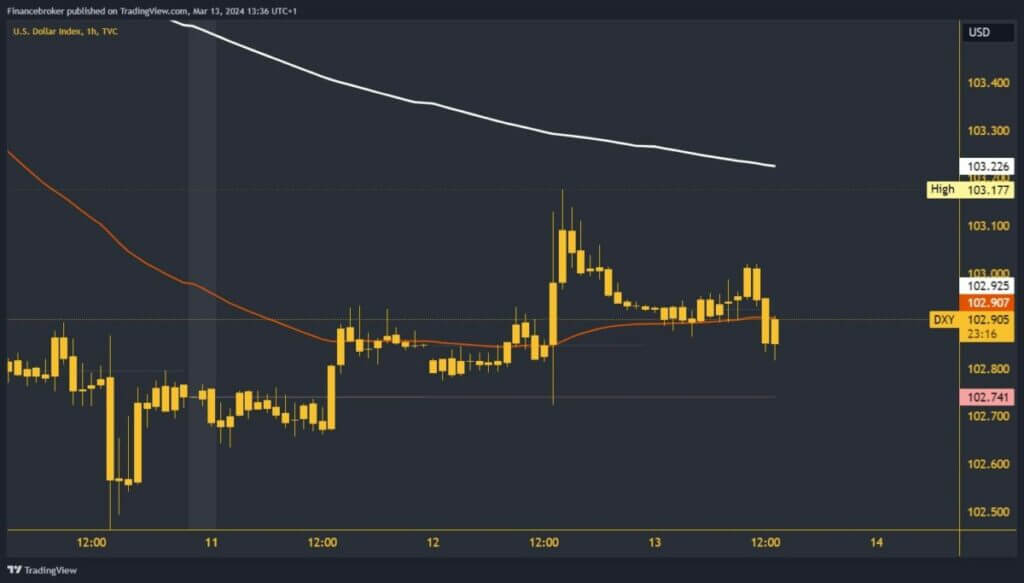
The dollar index remains below 103.00 on the bearish side
- Since the beginning of the week, the dollar index has slightly recovered from 102.70 to 103.17 levels yesterday.
Dollar index chart analysis
Since the beginning of the week, the dollar index has slightly recovered from 102.70 to 103.17 levels yesterday. After that, the index stopped at that level and began to retreat to 102.92. During the Asian trading session, the dollar managed to stay above that level and reach 103.00. There, we encountered new resistance and made a bearish consolidation up to 102.82 levels.
With this step, the index’s value dropped to a new daily low, which is considered negative and distracts us from the previous recovery. The EMA50 moving average at the 102.90 level creates additional pressure. We now expect to see a further pullback and test of the weekly open price at 102.74.

Do we stay below 103.00, or will we see the dollar index recover above that level?
Failure to hold above will push the dollar further lower and extend the pullback. Potential lower targets are 102.70 and 102.60 levels. We need a return in the zone around 103.00 for a bullish option. The new testing would give the index hope that it has a chance to move above and continue on the bullish side. Potential higher targets are 103.10 and 103.20 levels. We will have additional resistance in the EMA200 moving average in the zone around 103.20 levels.
This morning, we had news on British GDP; the data was in line with forecasts. In the afternoon, in the US session, the important news is Crude oil Inventories. The movement of oil stocks can give us an insight into the direction of the US economy. Tomorrow, we have a bunch of news from the US market: Core Retail Sales, Initial Jobless Claims, PPI index, and Retail Sales. We expect this news to give the dollar index a good shake-up.


