The dollar index moved above 106.50 at the end of the week
- The dollar index started this week at the 106.16 level.
Dollar index chart analysis
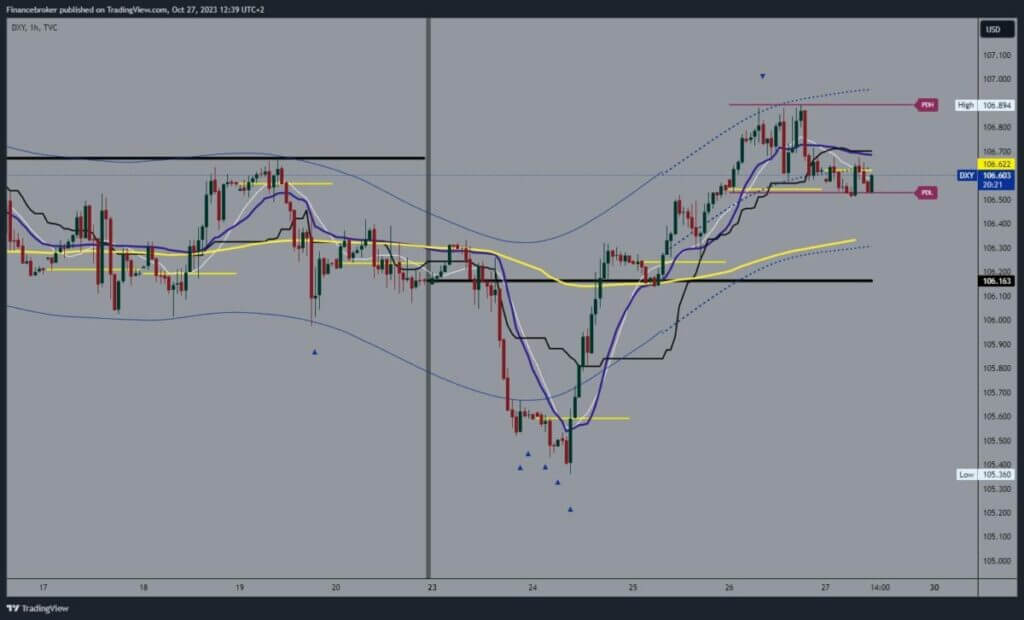
The dollar index started this week at the 106.16 level. In the first two days, we saw a pullback and the formation of a low dollar at the 105.36 level. We managed to get support at that level and initiate a bullish consolidation that took the dollar to the 106.89 level. In that zone, we encountered resistance, and after that, we did not manage to break through above but began to retreat.
During the previous Asian trading session, the dollar had resistance at the 106.70 level, which triggered a bearish consolidation and a drop to the 106.52 level. A fall below this support would lead to the formation of a new low, and we would have a strong bearish option. Potential lower targets are 106.40 and 106.20 levels.

What do we need for the growth of the dollar?
We need a positive consolidation and price return to the 106.80 level for a bullish option. Then we should move above and try to stay up there. After that, we could expect to start further growth and form a new high dollar index. Potential higher targets are 107.00 and 107.10 levels.
Next week is full of economic news from all three markets: Asia, Europe and the US. The most important news is the FED’s decision on the future interest rate. Estimates are that the interest rate will remain at the same level as before at 5.50%. Also important will be the Bank of England’s report on their future interest rate. The interest rate is also expected to remain at the same level. Other news is German GDP, European CPI, Chinese Manufacturing PM, NFP report and the US unemployment rate.


