Bitcoin and Ethereum: Bitcoin finds support at $28200
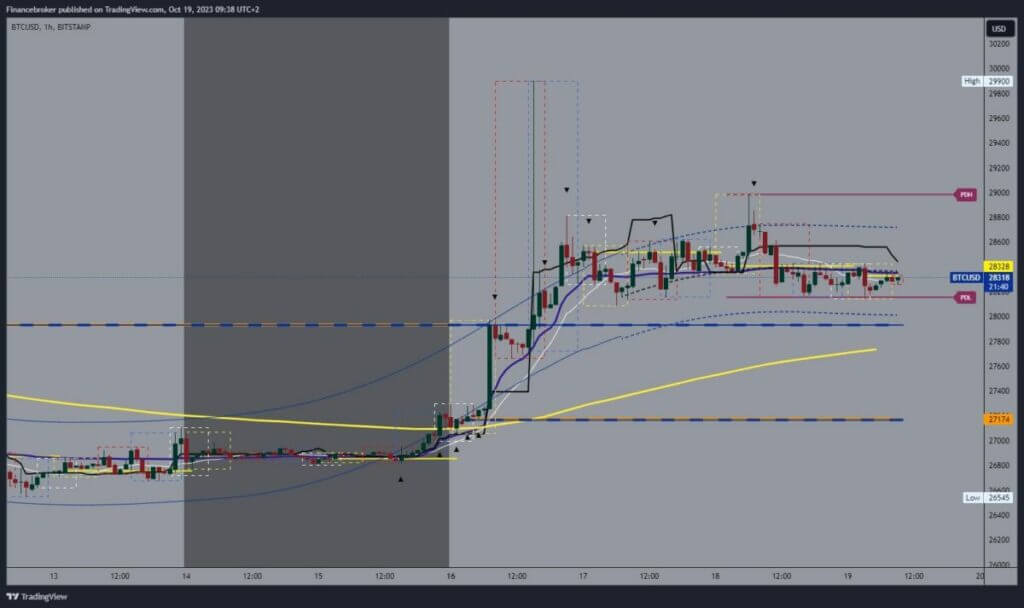
- The price of bitcoin in the previous 12 hours moved in the $28200-$28400 range.
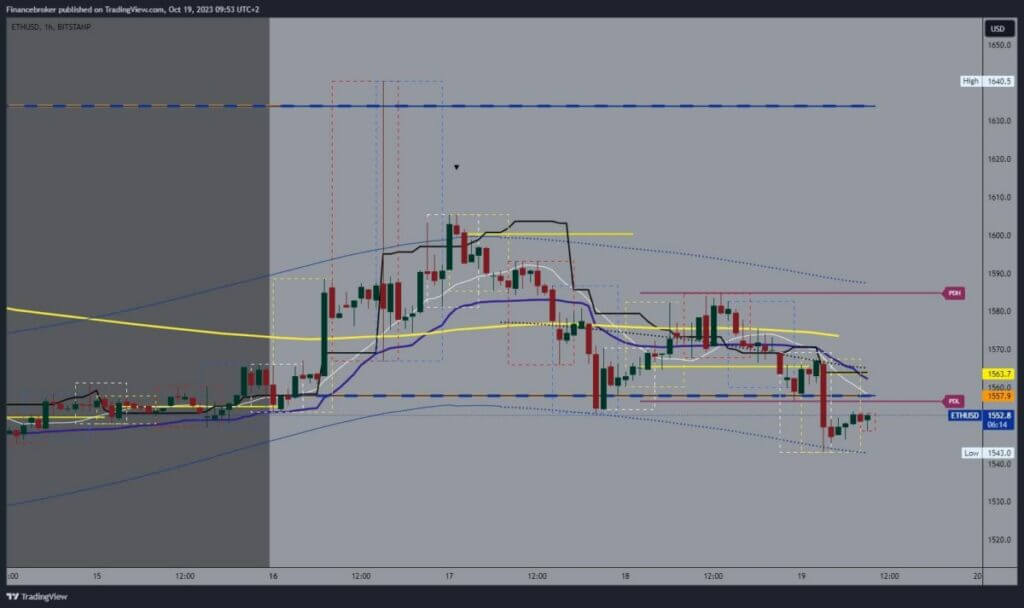
- The price of Ethereum fell this morning to a new low for the week at the $1543 level.
Bitcoin chart analysis
The price of bitcoin in the previous 12 hours moved in the $28200-$28400 range. At the moment, we are still in that zone, and we are continuing with consolidation. A certain bearish pressure prevents us from breaking above the $28400 level. So it is possible that we will see a decline below the $28200 level and visit the support at the $28000 level.
The EMA50 moving average is in the zone around $27,800, and we could expect more specific support there. We need a positive consolidation and a break above the $28400 level for a bullish option. Then, we would have to hold above there in order to launch a continuation to the bullish side from there. Potential higher targets are $28600 and $28800 levels.

Ethereum chart analysis
The price of Ethereum fell this morning to a new low for the week at the $1543 level. Since then, we have been in a mild bullish consolidation, moving up to the $1554 level. It would be good if we moved above the $1,560 level, and thus we would return above the weekly open price. There, we could get new support and form a bottom from which we could start the continuation of the recovery. Potential higher targets are $1570 and $1580 levels.
In the zone around the $1570 level, we encounter the EMA50 moving average, and we would have to jump over it if we plan a recovery. We need a negative consolidation and price pullback below the $1543 support level for a bearish option. In this way, we could form a new low and thereby confirm the bearish side. Potential lower targets are $1540 and $1530 levels.


