The dollar index is at an important turning point this week
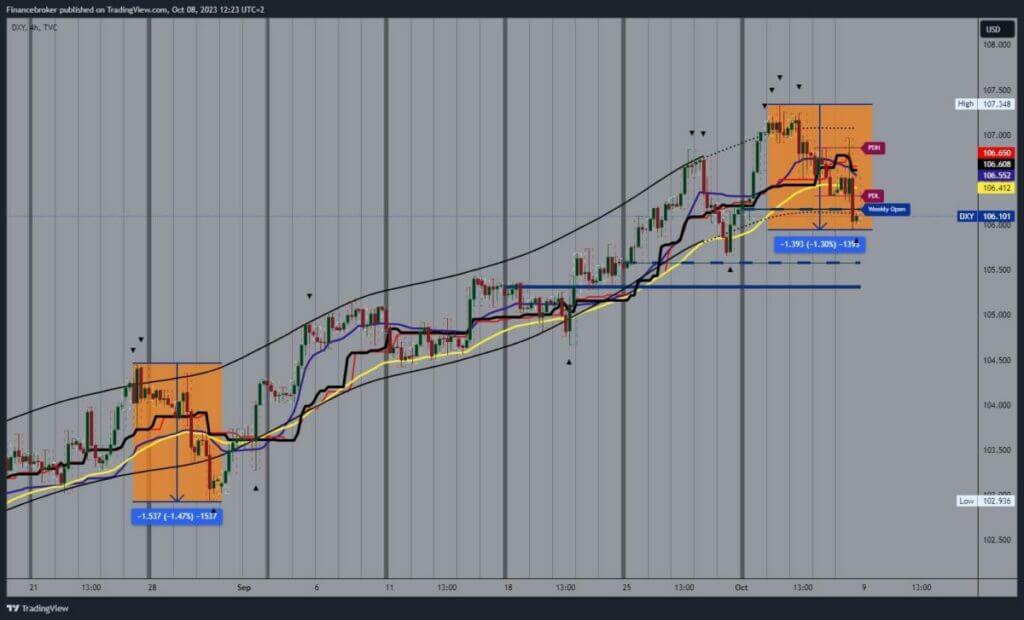
- At the beginning of this week, we saw the formation of a new high dollar index at the 107.34 level.
Dollar index chart analysis
Today’s chart review will be on a four-hour time frame in order to give us a broader overview of dollar index movements in the previous period, and based on that, we will analyze the future potential trend.
At the beginning of this week, we saw the formation of a new high dollar index at the 107.34 level. The dollar stopped its growth at that level and started a retreat below the 107.00 level. In the rest of the week, the dollar continued to slide down, and on Friday, it fell to 106.00 leva. For now, we have stopped at that level and are waiting for the beginning of the new week to continue.

What happened to the negative for the Dollar index?
The negative for the dollar index is that it fell below the EMA50 moving average and lost its support. This could be negatively reflected by increasing pressure on the dollar. We would then see a break below the 106.00 level and a pullback to lower support levels. Potential lower targets are 105.50 and 105.00 levels. With that move, we would form a new October lower low and confirm the bearish scenario.
With a new bullish consolidation, we need to return above the 106.50 level for a bullish option. Thus, we would be able to get back above the EMA50 moving average and look for its support. The next target is the 107.00 level, and a break above it could further strengthen the position of the dollar to continue on the bullish side. Potential higher targets are 107.50 and 108.00 levels.
This week will also be dominated by economic news from the US market: Producer Price Index, US Core CPI, US CPI, Initial Jobless Claims and FOMC Meeting Minutes. The German CPI and the U.K. Gross Domestic Product (GDP) are other important news.


