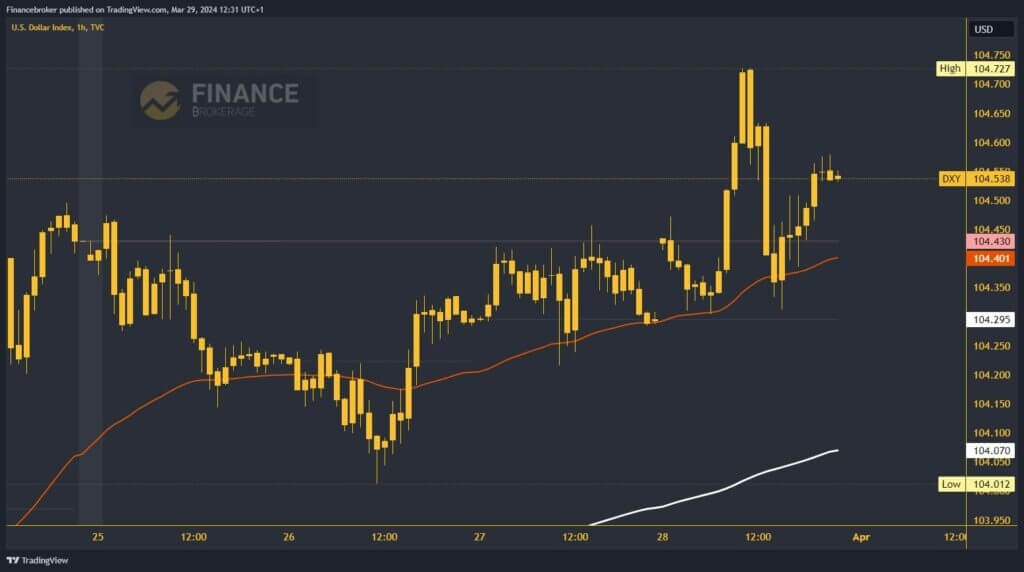
The dollar index could close this week above 104.50 level
- On Thursday, the dollar index rose to a weekly high of 104.72.
Dollar index chart analysis
On Thursday, the dollar index rose to a weekly high of 104.72. We stayed up for a short time, followed by a pullback to 104.35 levels. There, we encounter the EMA50 moving average, which provides support and does not allow us to move below. The index begins a bullish consolidation and returns above the weekly open price at 104.43.
The dollar index is positive again after that, and that pushes it to 104.55 levels. We expect to continue higher above 104.60 and try to retest the 104.70 level. Potential higher targets could be 104.80 and 104.90 levels. We need a negative consolidation and pullback down to the 104.30 level for a bearish option. There we test the previous two-day support zone.

Did the dollar have the strength to climb to 105.00 next week?
If we do not have the strength to hold above, a pullback below to a new daily low will follow. Thus, we get confirmation of the bearish momentum and expect further continuation to the bearish side. Potential lower targets are 104.20 and 104.10 levels. In the zone around 104.10, the index encounters the EMA200 moving average, and it could provide us with the required support.
There is no economic news in the EU session, while in the US session, we have the Core PCE Price Index, Personal Spending, and Fed Chair Powell Speaks. Powell’s speech should bring more volatility to the market and the dollar index chart. A projection of the future interest rate by the FED is expected, as well as expectations of the direction in which the American economy will go.


