S&P500 and Nasdaq indices: Nasdaq slips below 17960.0
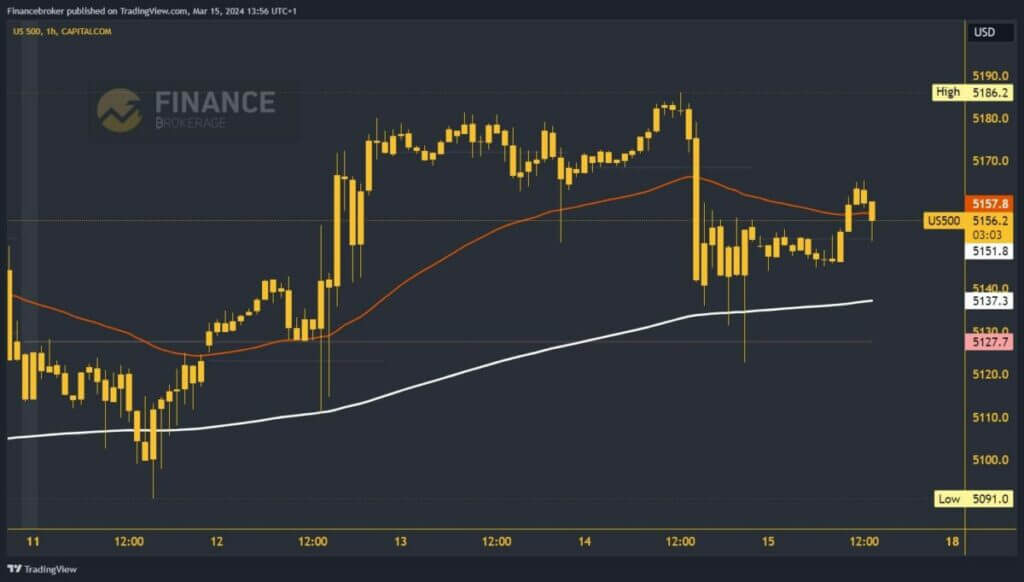
- Yesterday’s attempt of the S&P500 index to reach a new high was stopped at the 5186.2 level.
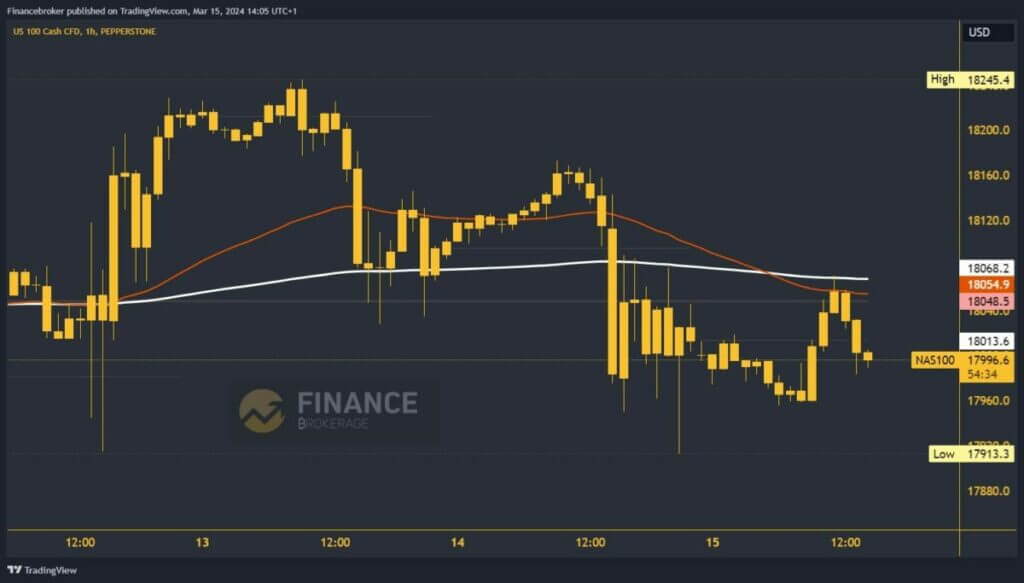
- This week’s high value of the Nasdaq index was on Wednesday at the 18245.4 level.
S&P500 index chart analysis
Yesterday’s attempt of the S&P500 index to reach a new high was stopped at the 5186.2 level. After that, two bearish impulses took us down to the 5140.0 support level. Since then, we have been in sideways consolidation in the 5140.0-5155.0 range. We have additional support in the EMA200 and we hope for continuation and growth on the bullish side. During the Asian session the index gave us indications that we could see a break above and rise to a new daily high.
That’s what happened with the jump to 5165.0 levels. We are successfully holding above the 5155.0 level and expect a retest and a new impulse for the continued bullish side. Potential higher targets are 5170.0 and 5180.0 levels. We need a negative consolidation and a drop to 5140.0 and the EMA200 support level for a bearish option. The breakout below pushes the index to form a new weekly low, and the potential lower targets are 5130.0 and 5120.0 levels.

Nasdaq index chart analysis
This week’s high value of the Nasdaq index was on Wednesday at the 18245.4 level. After that, we saw the initiation of bearish consolidation up to the 18030.0 level. We managed to stay above it on Wednesday and get support from the EMA200 moving average. On Thursday, we climbed up to the 18175.0 level, and there, we met a new resistance, forming a new lower high compared to the day before.
From that level, we started another pullback until last night at the 17913.3 level. During the Asian session, we moved back above the 17960.0 level and are now trying to stabilize around the 18000.0 level. Today’s resistance is at the 18070.0 level from the EMA200 moving average. For now, we are staying below and looking on the bearish side. A new impulse could easily take us below the 17960.0 support level, and the potential lower targets are the 17920.0 and 17900.0 levels.


