Oil Market Update: What’s Going on at the $76.50 Level?
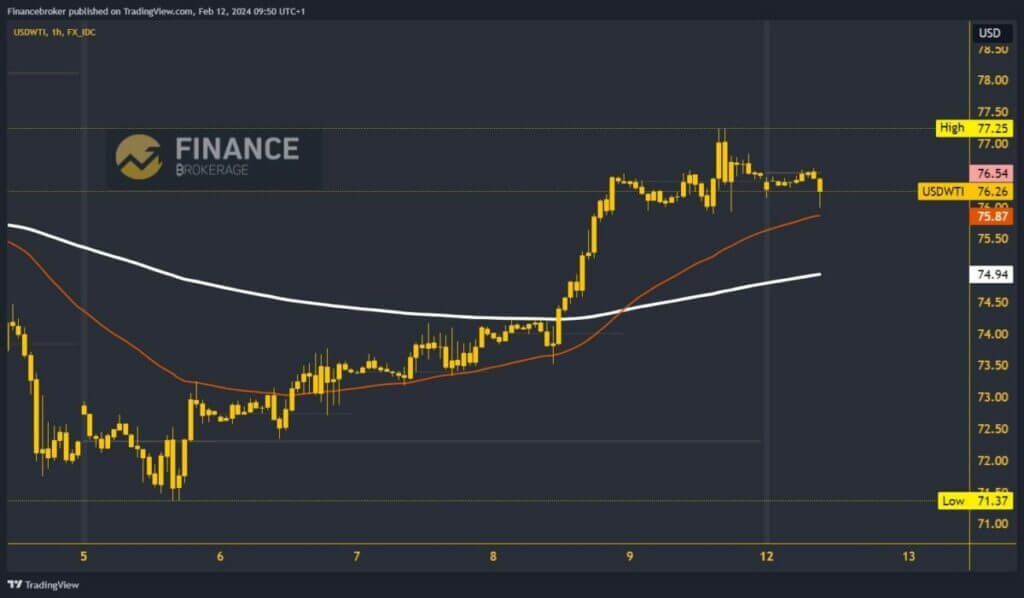
- On Friday, we saw a jump in the price of oil to the $77.25 level.
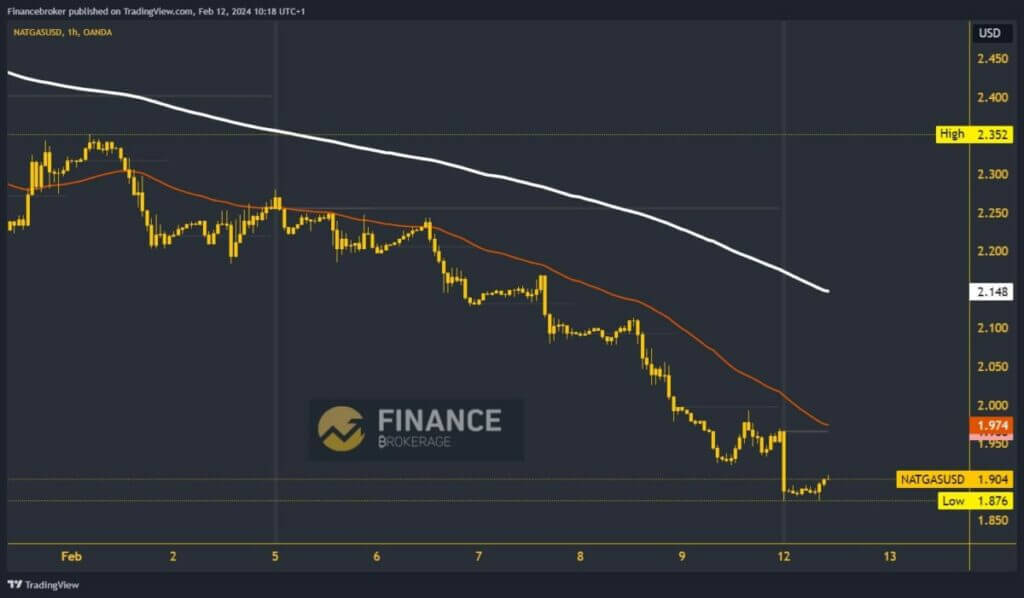
- The price of natural gas created a new bearish gap at the initial market opening last night, going down to the $1.87 level.
Oil chart analysis
On Friday, we saw a jump in the price of oil to the $77.25 level. This created a new weekly high for oil prices, and after that, we stopped there. During this morning’s Asian trading session, the price retreated and hovered around the $76.50 level.
At the beginning of the EU session, the price was under bearish pressure, and we saw a pullback with the formation of a daily low at the $76.00 level. This could increase the bearish momentum for continued oil price retreat.
Potential lower targets are $75.50 and $75.00 levels. In the zone around $75.00, we could get additional support in the EMA200 moving average. The oil price would have to move to the $77.00 level for a bullish option.
Thus, it would form a new daily low and jump above the Asian price movement. We would have another opportunity to test the price high from Friday at the $77.25 level. Potential higher targets are $77.50 and $78.00 levels.

Natural gas chart analysis
The price of natural gas created a new bearish gap at the initial market opening last night, going down to the $1.87 level. A new annual price low has been formed, and natural gas manages to stop there and begin a slight recovery to the 1.90 level.
We need a continuation of positive consolidation and a return above the $1.95 level for further recovery. There, we would be close to the weekly open price.
Moving above the gas price would significantly gain strength to start a further recovery. Potential higher targets are $2.00 and $2.05 levels. If natural gas prices do not have the strength to grow, we will see a new test of this morning’s support zone.
A breakout below takes us to a new lower low for gas prices and thus confirms the primacy of the bearish side. Potential lower targets are $1.85 and 1.80 levels.


