Oil falls below $75.00, while Natural Gas slips below $2.75
- During the Asian fattening session, oil prices continued to retreat, forming a low at $74.64.
- The price of natural gas continues to retreat this week.
Oil chart analysis
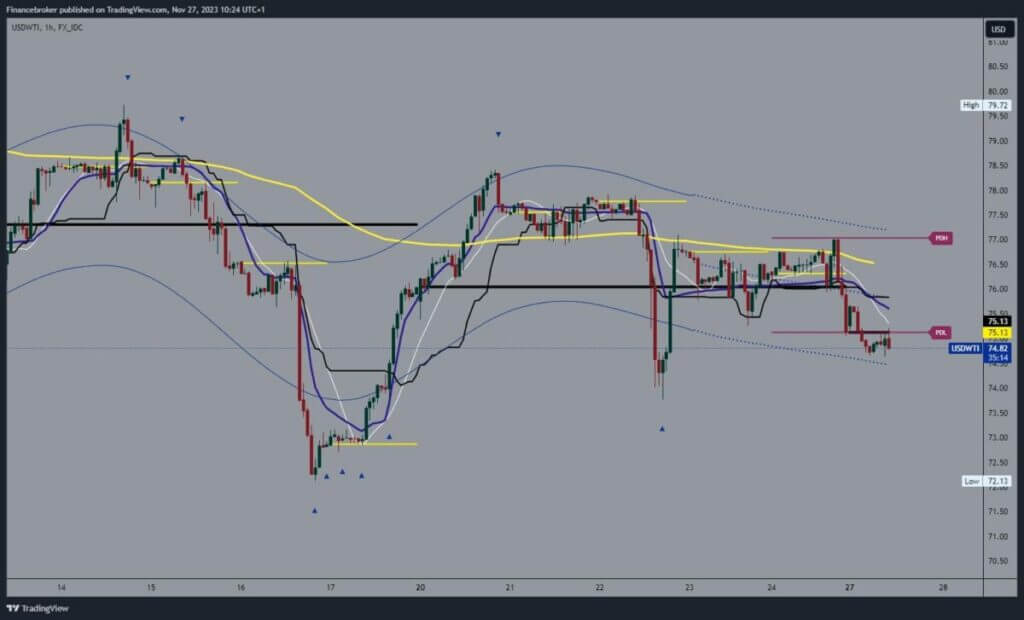
During the Asian fattening session, oil prices continued to retreat, forming a low at $74.64. We got support in that zone and initiated a bullish consolidation that brought us back above the $75.00 level. We now need to hold above the $75.00 level in order to initiate a bullish consolidation from there and begin a continued recovery. Potential higher targets are $76.00 and $76.50 levels.
Additional resistance for oil price could be found in the EMA50 moving average. We need a negative consolidation and a rejection of the $75.00 level for a bearish option. Next, we need to see a break below the $74.50 level, and in that way we would form a new price low for this week. Potential lower targets are $74.00 and $73.50 levels.

Natural gas chart analysis
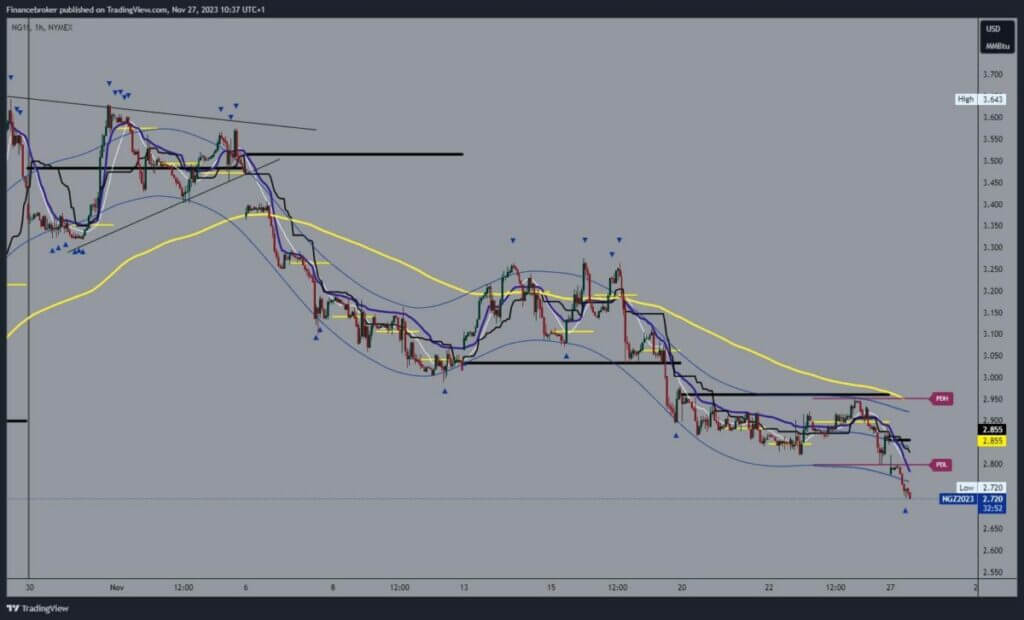
The price of natural gas continues to retreat this week. We saw a bearish gap from $2.85 to the $2.80 level at the market’s opening. During the Asian trading session, the price continued to retreat and is now at the $2.75 level. Currently, the price is under a lot of pressure, and a continuation on the bearish side is a realistic option. Potential lower targets are $2.70 and $2.65 levels.
We need a positive consolidation and a return above $2.80 for a bullish option. After that, it is necessary to hold on to that level in order to form a bottom from which to start a new bullish consolidation. Potential higher targets are $2.85, $2.90 and $2.95 levels. We will have additional resistance in the EMA50 moving average in the zone around the $2.95 level.


