Oil and natural gas: The price of oil rises to $79.50
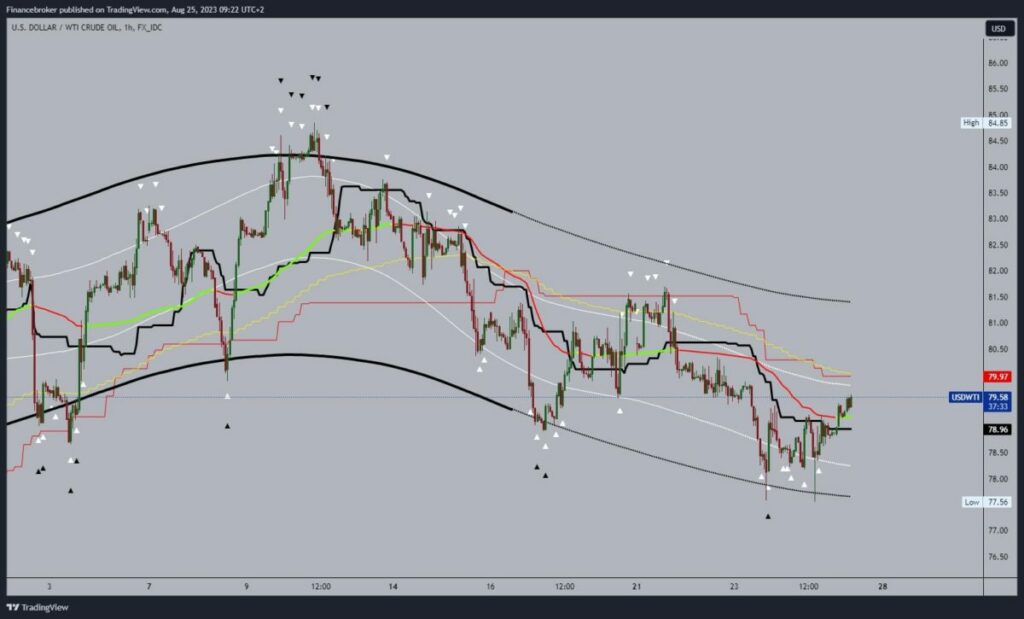
- The oil price is recovering after yesterday’s retreat to $77.56.
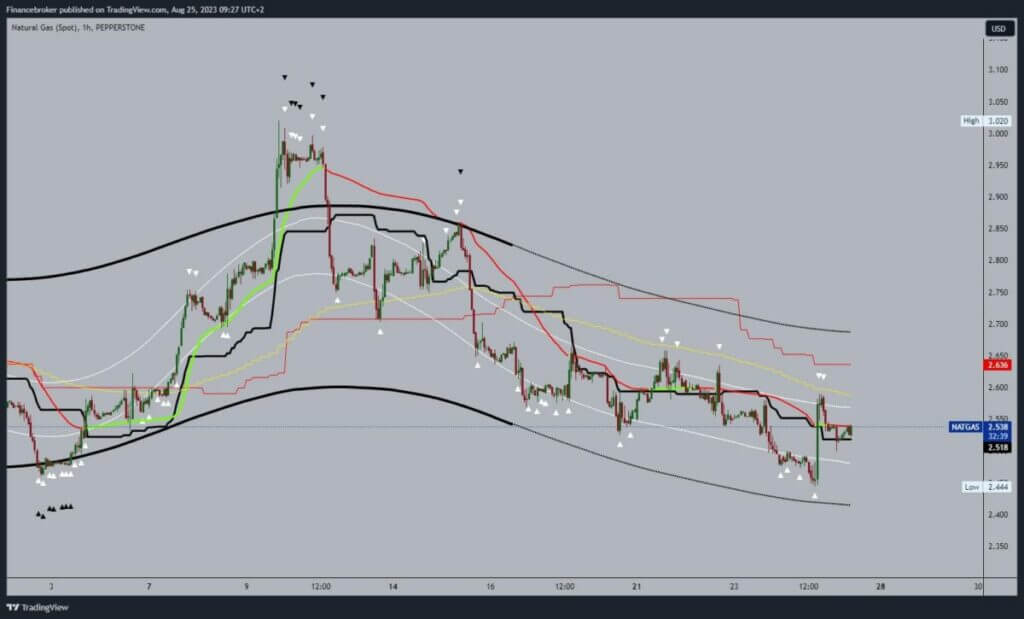
- The price of natural gas fell to $2.44 yesterday.
Oil chart analysis
The oil price is recovering after yesterday’s retreat to $77.56. During the Asian trading session, we saw the return of the oil price above the $79.00 level. We are now at $79.60 and on our way to the $80.00 level. In the zone around the $80.00 level, we encounter the EMA50 moving average, which could be an obstacle or slow down this recovery. A break above it would mean a further increase in the price of oil. Potential higher targets are $81.00 and $82.00 levels.
We need a negative consolidation and pullback to the $79.00 level for a bearish option. If the price falls below it, we will increase the bearish pressure to continue on the bearish side. Potential lower targets are $78.00 and $77.00 levels.

Natural gas chart analysis
The price of natural gas fell to $2.44 yesterday. From there, a strong bullish impulse followed, and the price jumped almost to the $2.60 level. That’s where we meet resistance and pull back during the Asian trading session. The price receives support at the $2.50 level, from which it tries to initiate a new bullish consolidation. In the zone around $2.60, we have additional resistance in the EMA50 moving average, and we need a break above to continue to the bullish side.
Potential higher targets are $2.65 and $2.70 levels. We need a negative consolidation and a new pullback below the $2.50 level for a bearish option. After that, we probably tested the previous low again at the $2.44 level. Potential lower targets are $2.40 and $2.35 levels.


