Oil and Natural Gas: Support at $72.00 level for oil price
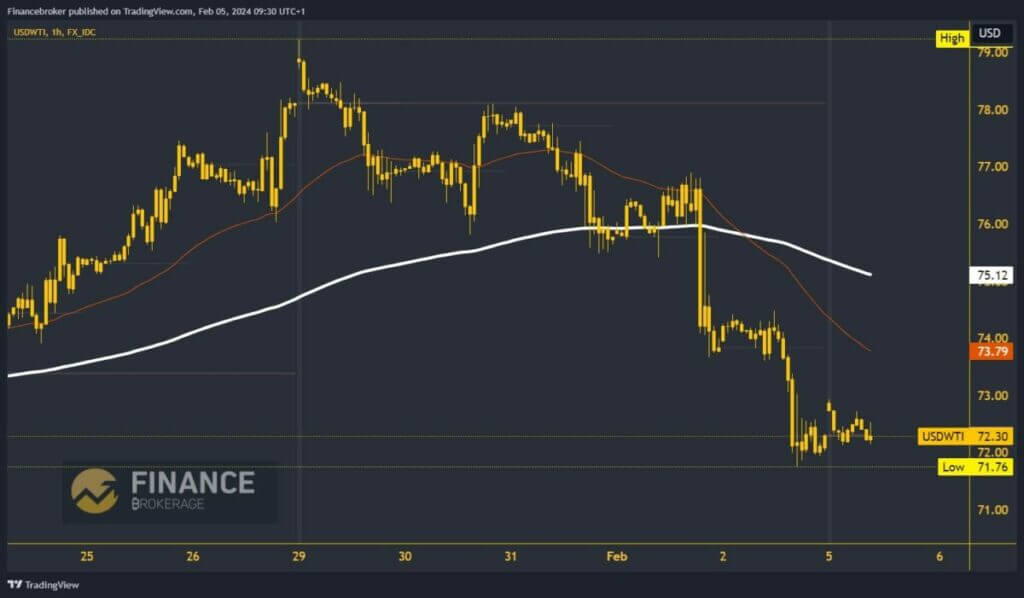
- During the Asian trading session, the oil price remained in last week’s support zone of $72.00-$73.00.
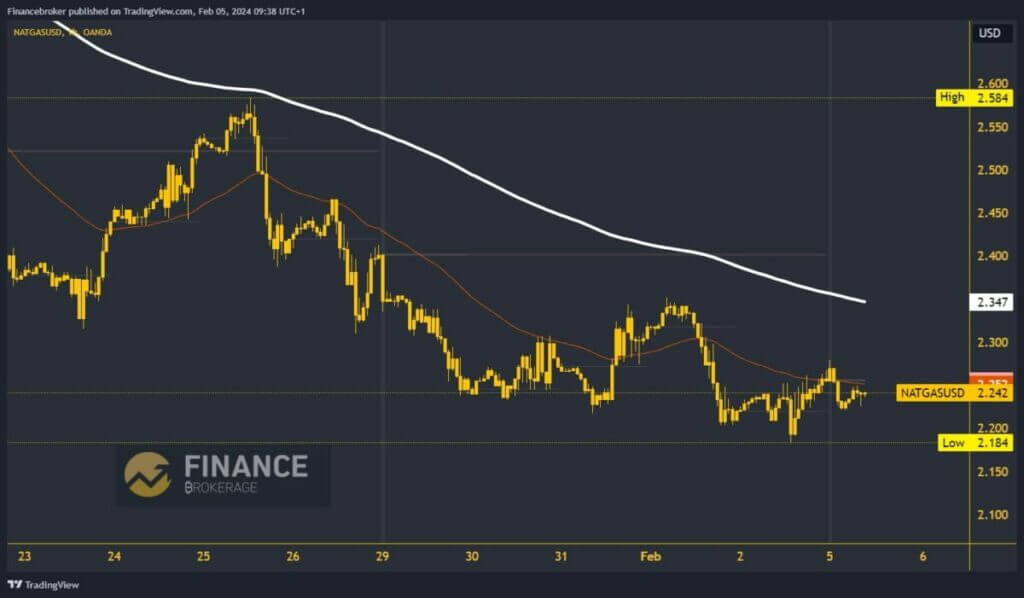
- On Friday, the price of natural gas fell to a new low this year at $2.18.
Oil chart analysis
During the Asian trading session, the oil price remained in last week’s support zone of $72.00-$73.00. The events in the Middle East did not cause the price to rise. We are looking at the opposite situation on the chart, and the price is falling. Oil is currently hovering around the $72.25 level, and now, in the EU session, there is a potential new price pressure that could push it even lower and form a new price low. In that way, we would see a two-week low, and the potential lower targets are $71.50 and 71.00.
To recover the oil price, we need a growth above $73.00 and to hold then up there. After that, we would have good support to produce an impulse to move us out of bearish pressure and climb to higher levels. Potential higher targets are $74.00 and $75.00 levels. Additional average price could get in EMA200 around $75.00 level.

Natural gas chart analysis
On Friday, the price of natural gas fell to a new low this year at $2.18. Somehow, the price managed to rise above and close the day at the $2.25 level. During the previous Asian session, we saw that natural gas was under pressure and failed to move above the market closing price. The picture tells us that we could slip below $2.20 again and threaten the previous low. Potential lower targets are $2.15 and $2.10 levels.
We need to move up to the $2.30 level for a bullish option. With that, we would form a daily high and bring some optimism for a potential continuation to the bullish side. If we manage to stay above $2.30, the price could start a bullish consolidation and get rid of the bearish pressure. Potential higher targets are $2.35 and $2.40 levels.


