Oil and natural gas: Oil retreated to the $82.00 level
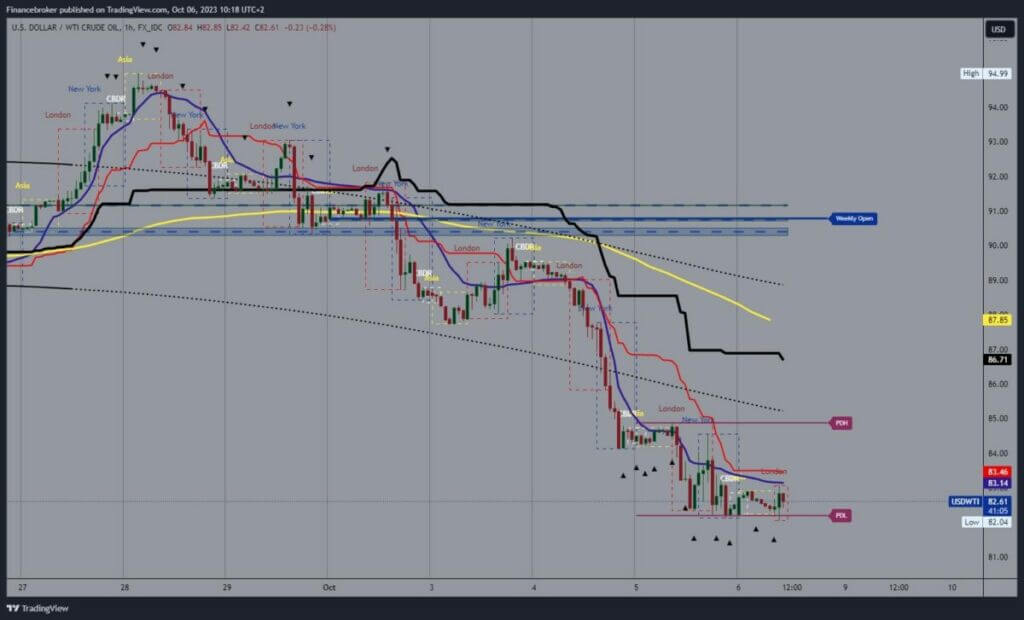
- From last Thursday to this morning, the price of oil fell by $13.00.
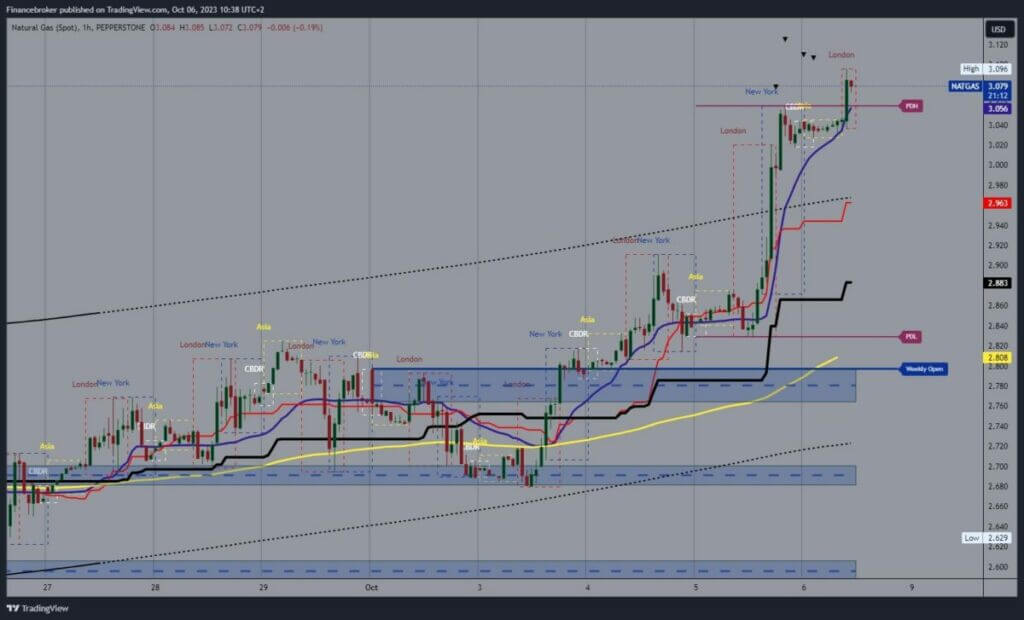
- The first week of October was very bullish for the price of natural gas.
Oil chart analysis
From last Thursday to this morning, the price of oil fell by $13.00. From $95.00 to $82.00 this morning. In the previous 12 hours, oil managed to slow down the decline and stay above the $82.00 level. It would need to move above the $83.00 level to take the first step towards a potential recovery. Then, it is necessary to maintain above that level and to form a new oil price bottom there.
After that, we could expect to see continued recovery and oil price growth on the bullish side. Potential higher targets are $84.00 and $83.00 levels. We need a negative consolidation and a breakout of the oil price below the $82.00 support level for a bearish option. A fall below would lead to the formation of a new lower low, and thus, we would see confirmation of the bearish option. Potential lower targets are $81.00 and $80.00 levels.

Natural gas chart analysis
The first week of October was very bullish for the price of natural gas. We started Monday at the $2.68 level and are now at the $3.10 level. During the previous Asian trading session, the price was maintained around the $3.04 level, and at the beginning of the EU session, we saw a bullish impulse and a jump to a new high.
If we manage to hold above this morning’s support zone, we could expect the price to continue to break above and form a new high. Potential higher targets are $3.12 and $3.14 levels. We need a negative consolidation and pullback to the $3.00 support level for a bearish option. A break below could indicate that we will see a continuation of the decline to the bearish side. Potential lower targets are $2.95 and $2.90 levels.


