Oil and natural gas: Oil remains stable above $80.00
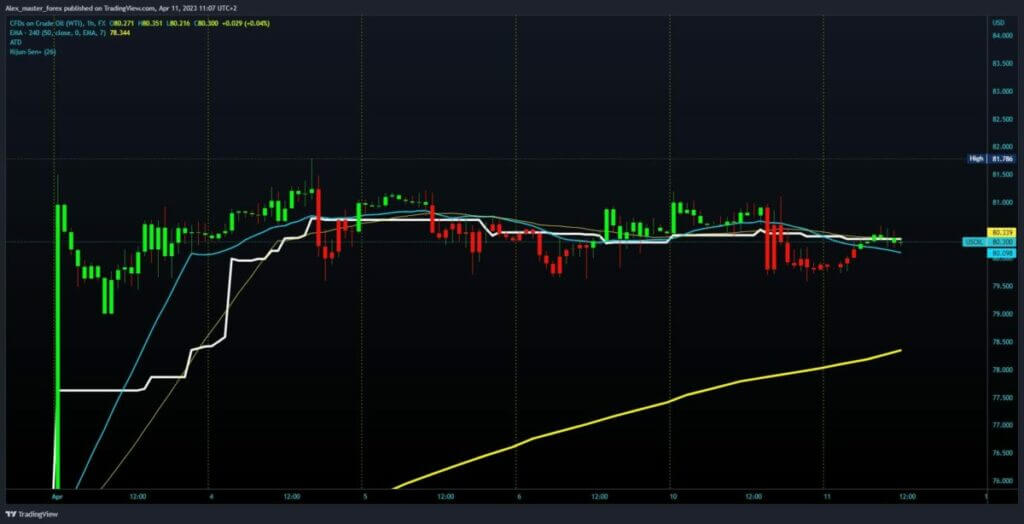
- There are no changes on the oil chart compared to the previous days.
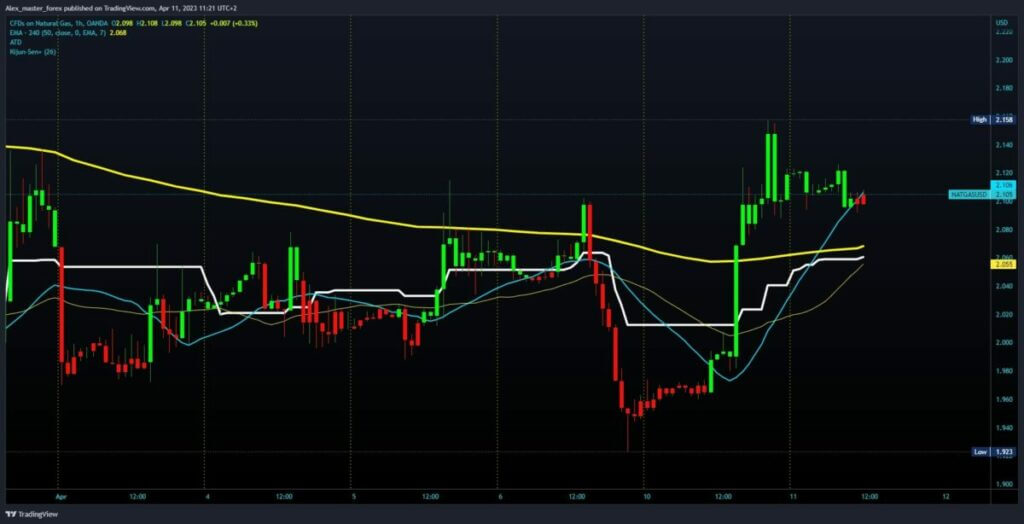
- The price of natural gas yesterday was bullish, with $1.96 to $2.15 levels.
Oil chart analysis
There are no changes on the oil chart compared to the previous days. Oil prices continue to move sideways in the $79.50-$81.50 range. Yesterday, the price tested support at $79.50, after which we saw bullish consolidation and a return around the $80.00 level. We expect the price to recover to $81.00 and test the upper resistance level. If we climb above and hold there, we will have a better new starting position to continue the recovery. Potential higher targets are the $82.00 and $83.00 levels. We need a break below the support at the $79.50 level for a bearish option. After that, we would see a further pullback to some lower support. Potential lower targets are the $79.00 and $78.00 levels.

Natural gas chart analysis
The price of natural gas yesterday was bullish, with $1.96 to $2.15 levels. The price encounters resistance there and starts a pullback. During the Asian trading session, the price moved in the $2.10-$2.12 zone. We need to hold above the $2.05 level for a bullish option. Additional price support at that level is in the EMA50 moving average. With the new momentum, we could go up and test the previous high at the $2.15 level. Potential higher targets are the $2.184 and $2.20 levels. We need a negative consolidation and pullback below the moving average and the $2.05 level for a bearish option. We would be one step closer to the $2.00 level by falling below. Potential lower targets are the $1.95 and $1.90 levels.


